Top Off Salinity Drift Calculator
Estimate salinity rise from evaporation, delayed freshwater top-off, ATO interval, safe swing limits, and reservoir coverage.
💧Tank Volume, Evaporation, ATO, And Swing Inputs
🌊Tank And Evaporation Comparison Grid
🧪Salinity Profile Reference
| Profile | Typical Target | Calculator Swing | Planning Note |
|---|---|---|---|
| SPS dominant reef | 35 ppt | 0.20 ppt | Small systems need frequent ATO checks |
| Mixed reef | 35 ppt | 0.35 ppt | Good default for most reef displays |
| Soft coral reef | 34 ppt | 0.50 ppt | Allows a slightly wider routine swing |
| FOWLR marine | 32 ppt | 0.75 ppt | Often more tolerant than coral systems |
| Low brackish | 7 ppt | 0.30 ppt | Lower absolute drift at the same water loss |
| Mid brackish | 15 ppt | 0.50 ppt | Still benefits from steady top-off |
| Hyposalinity quarantine | 14 ppt | 0.20 ppt | Keep treatment salinity tightly controlled |
⏱Top-Off Timing Reference
| Top-Off Pattern | Best For | Main Drift Driver | Calculator Input To Watch |
|---|---|---|---|
| Continuous ATO | SPS, nano reefs, open tops | Sensor deadband | ATO level deadband |
| Hourly pump | Reef controllers and dosers | Hourly evaporation pulse | ATO interval |
| Twice daily manual | Covered marine tanks | Longest skipped interval | Top-off delay |
| Once daily manual | Larger forgiving systems | Full day evaporation | Allowed salinity swing |
| Travel reservoir | Weekend and vacation gaps | Reservoir depletion | Reservoir size |
📏Common Tank Drift Examples At 35 ppt
| System | Net Volume | Evaporation | Approx 12h / 24h Rise |
|---|---|---|---|
| Covered 10 gal nano | 10 gal / 38 L | 0.15 gal/day / 0.57 L/day | +0.26 / +0.53 ppt |
| Open 20 gal cube | 20 gal / 76 L | 0.45 gal/day / 1.7 L/day | +0.40 / +0.81 ppt |
| 40 breeder rimless | 40 gal / 151 L | 0.70 gal/day / 2.6 L/day | +0.31 / +0.62 ppt |
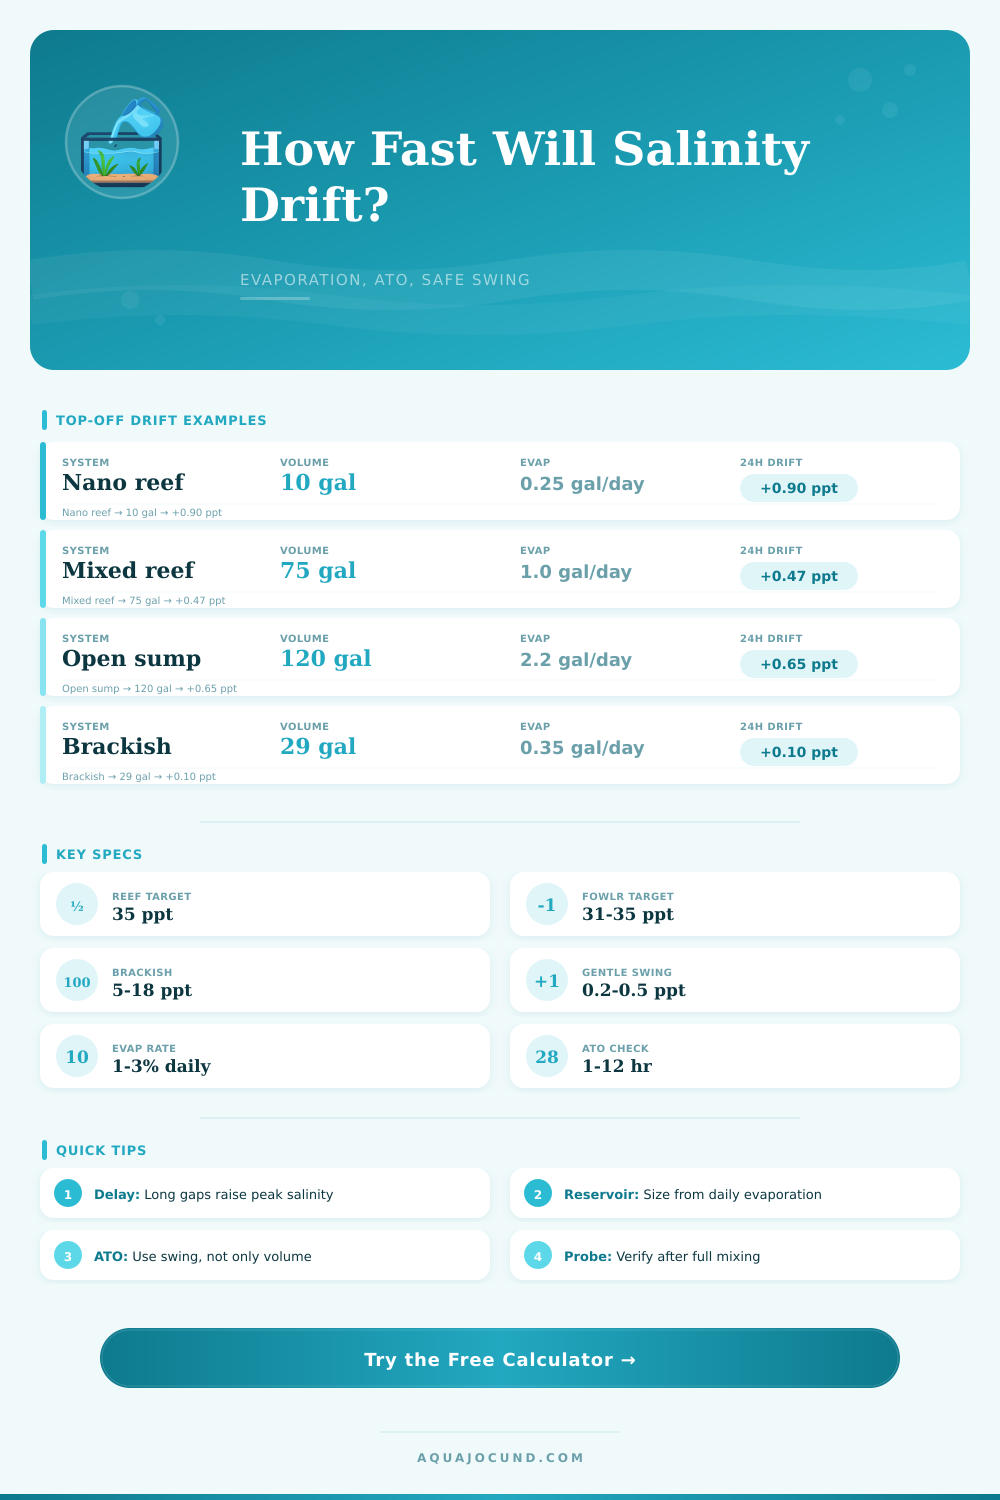
| 75 gal mixed reef | 75 gal / 284 L | 1.00 gal/day / 3.8 L/day | +0.23 / +0.47 ppt |
| 120 gal reef with sump | 120 gal / 454 L | 2.20 gal/day / 8.3 L/day | +0.32 / +0.65 ppt |
| 180 gal large system | 180 gal / 681 L | 3.00 gal/day / 11.4 L/day | +0.29 / +0.59 ppt |
💦Reservoir And Deadband Planning Table
| Planning Item | Typical Range | Why It Matters | Calculator Effect |
|---|---|---|---|
| ATO deadband | 0.05-0.50% of volume | Water can fall before the pump starts | Adds to peak salinity loss |
| Reliability margin | 10-25% | Allows for heat, fans, sensor lag, and pump variation | Shortens the safe interval |
| Reservoir size | 3-7 days of evaporation | Prevents dry pump and sudden manual gaps | Shows coverage days |
| Manual delay | 8-24 hours | Missed top-off creates the largest swing | Sets the delay salinity peak |
| Probe confirmation | After full mixing | Display and sump may lag after top-off | Use result as planning, then verify |
There’s nothing quite like that silent panicky feeling that comes over you when you discover that your reef tank is down another inch of water overnight. You can’t put your finger on it just yet, but you recognize what has happened. The amount of dissolved salt. Everything that makes your reef tank salty, has not changed.
What has changed is the amount of pure water that has dissapears into thin air as vapor. The volume have decreased, but salinity has risen. This means concentration has increased. It also shows how small amounts of neglect can lead to big changes, but in wrong direction. It also means that you should of be able to measure that change before it turns into a biological issue with your livestock.
Why Water Level Drops Change Salt Levels
Most hobbyers assume that keeping the water level constant keeps the chemistry stable, but it do not. Not true. Water salinity (ratio of salt mass to water volume) isn’t constant as you lose 2% of your volume via evaporation and don’t replace it. Your salinity increase by more than 2% relative to the remaining total mass. Why? Because the numerator remains fixed but the denominator decrease.
The calculator performs this math for you, no need to divide in your head each time you top off. It takes your actual measured evaporation rate and turns it into parts per thousand change, which is how your corals thinks about it.
Why does that matter? Each home are different. Some are extremely dry, while others have lots of humidity. Many homes even use heaters. A sealed nano tank in a humid basement might lose less than a pint a week, whereas others with large open sump systems in their houses where its really dry could be seeing a gallon evaporate every day.
But just as important is when it does replace water. It’s not unusual for an automatic top-off device to monitor tank levels every couple of hours. But it’s those in-between times that do biological damage. Your pump may trigger too infrequently, this results in a slow, creeping salinity increase between pumps, creating a sawtooth shape instead of a stable baseline. You can set a safe swing limit in the tool so it will alert you before salinity reaches a level above which your stock becomes stressed (i.e., bleaches, stunts). Tanks with only fish can be much more forgiving here then, for example, SPS corals that require tight control and often demand less than a half part per thousand swing. Get this setting right and you won’t have to over-engineer your automation but still protect delicate life.
People often forget another subtlety until they has problems: deadband. This is the buffer zone between when water rises enough to signal the sensor to start refilling and when it actualy does. This prevents the pumps from cycling too fast, which saves electricity and protects hardware. But every fraction of an inch in that deadband translates to a real salinity rise during the delay. Your peak salinity calculation account for that lag time. It tells you the actual highest point before the tank fills up again. This is critical information to help you determine whether you are at risk with what you have, or if you need something more sensitive to trigger faster.
A lot of people do not take reservoir planning into consideration and it’s a frequent point of failure in the event of a power fluctuation or heat wave. Knowing how long until you’re dry (i.e., your freshwater estimate) based off your daily rate of loss means no more frantic bucket fills at 2 AM when the ATO empties. It also shows where your existing container size just isn’t big enough for the evaporation rate of your tank(s).
All this leads me to conclude: Salinity drift is more about knowing what’s going on than it is about getting any single number right. After all, there’s nothing you can do to stop the humidity in your air from rising or falling, just as you cannot control nature itself. But if you know how much water you’re losing, how quickly, and therefore how concentrations will change over time, then something that could become a crisis becomes instead a simple habit. It’s not about preventing change altogether (because that’s unrealistic and naturaly), but it is about limiting change so that it occurs within tolerable limits for your livestock. This is where the practice of monitoring things comes in. What goes out of your tank in the form of vapor doesn’t have to come back in the form of stress for your livestock.