Salinity Dilution Calculator
Plan freshwater or lower-salinity water changes from current salinity, target salinity, system volume, change volume, and daily swing limits.
🧪Salinity Change Presets
📏Tank Volume
⚖Salinity and Dilution Inputs
Salinity Dilution Plan
💧Salinity Dilution Quick Specs
🐚Reef, Fish, and Invert Sensitivity Grid
📊PPT and Specific Gravity Reference
| Water type | Approx ppt | Approx SG | Planning note |
|---|---|---|---|
| Fresh RO/DI | 0 ppt | 1.000 | Use for evaporation top-off or dilution water |
| Low brackish | 5-8 ppt | 1.004-1.006 | Common for light brackish livebearer setups |
| Mid brackish | 12-18 ppt | 1.009-1.014 | Often changed in stages for puffers or gobies |
| Hyposalinity QT | 12-14 ppt | 1.009-1.011 | Use only with a suitable treatment protocol |
| Marine fish only | 30-33 ppt | 1.023-1.025 | Lower than many reef systems |
| Reef aquarium | 34-36 ppt | 1.026-1.027 | Keep corrections small for corals and inverts |
⏱Daily Swing Reference
| Livestock profile | Suggested daily limit | Best use | Extra caution |
|---|---|---|---|
| Delicate shrimp and inverts | 0.5 ppt | Acclimation and small reef corrections | Retest with calibrated gear |
| Mixed reef | 1.0 ppt | Routine correction after high evaporation | Watch corals, anemones, snails, and stars |
| Marine fish only | 2.0 ppt | Hardier display fish corrections | Keep temperature and pH matched |
| Brackish fish | 3.0 ppt | Gradual seasonal or target changes | Species history matters |
| Emergency high salinity | 4.0 ppt | Short-term safety planning only | Use observation and staged retesting |
🗂Common Tank Dilution Examples
| System volume | 1 ppt drop with RO/DI | 5 ppt drop with RO/DI | Reef planning note |
|---|---|---|---|
| 10 gal / 38 L | 0.3 gal / 1.1 L | 1.4 gal / 5.4 L | Small tanks change quickly |
| 20 gal / 76 L | 0.6 gal / 2.2 L | 2.9 gal / 10.8 L | Split if livestock is sensitive |
| 40 gal / 151 L | 1.1 gal / 4.3 L | 5.7 gal / 21.6 L | Retest after circulation |
| 75 gal / 284 L | 2.1 gal / 8.1 L | 10.7 gal / 40.5 L | Sump mixing can delay readings |
| 125 gal / 473 L | 3.6 gal / 13.5 L | 17.9 gal / 67.6 L | Use marked containers for repeat steps |
🔄Replacement Water Comparison
| Replacement water | Dilution strength | Typical situation | Calculator effect |
|---|---|---|---|
| RO/DI freshwater | Strongest | Evaporation correction and high SG | Smallest change volume needed |
| Low-salinity mix | Moderate | Gentler marine correction | More water needed than freshwater |
| Brackish mix | Targeted | Moving brackish tanks downward | Works only if below target |
| Matched saltwater | No dilution | Normal maintenance changes | Does not lower salinity |
| Higher-salinity water | Raises salinity | Not for dilution | Calculator flags it as invalid |
Water evaporates more often than you top it off, so high salinity becomes a stressor in an aquarium. Osmotic pressure increase within your livestock while salt crystals adheres to the glass. By the time you detect the problem, one of your shrimp isn’t eating or that anemone has closed up.
Diluting isn’t so much about doing it as planning on doing it. Rushing with freshwater dumps can result in localized areas of low salinity that will still shock the tissue regardless of how good the morning average reading appear. You want to get to target number but without inflicting any physiological damage to animal.
How to Safely Lower Salt Levels in Your Tank
When you enter your target shift and your system size, the calculator does the math (see above). It begins with the base level of understanding… Displacement, and saves you from trying to guess at conversions and coefficients.
Lots of us use some sort of measuring tape on our tanks and then simply estimate the total volume as what’s inside. We don’t account for water displacement by equipment, sump, live rock, sand substrate, etc. For example, most reef systems is typically discounted by 12% due to their fullness with structure.
Guessing results in an overestimate of the amount of water in your system, and therefore an underestimate of the amount of fresh water necessary to lower your specific gravity. When you feed this excess volume into the tool, it’ll recommend that you add less water then you need. Your salinity won’t move, but will instead stay stubbornly elevated.
The reference table shows both specific gravity (SG) and parts per thousand (PPT), which are two ways to express salinity. While SG is scale most optical refractometers show, PPT is linear and easier to use when doing the math for dilution. This tool handles converting from one to the other with no fuss.
However, knowing the type of replacement water you’re working with is far more important than the units you choose. Pure RO/DI freshwater will have the greatest dilution effect. Why? Because it has zero salts.
If you’re mixing something else, perhaps a lower-salinity buffer (then your math gets much differenter). Since that water already has a bit of salt load, you’ll need a greater volume to get the same drop. That’s why the calculator lets you enter the precise salinity of your replacement water; it takes that into consideration.
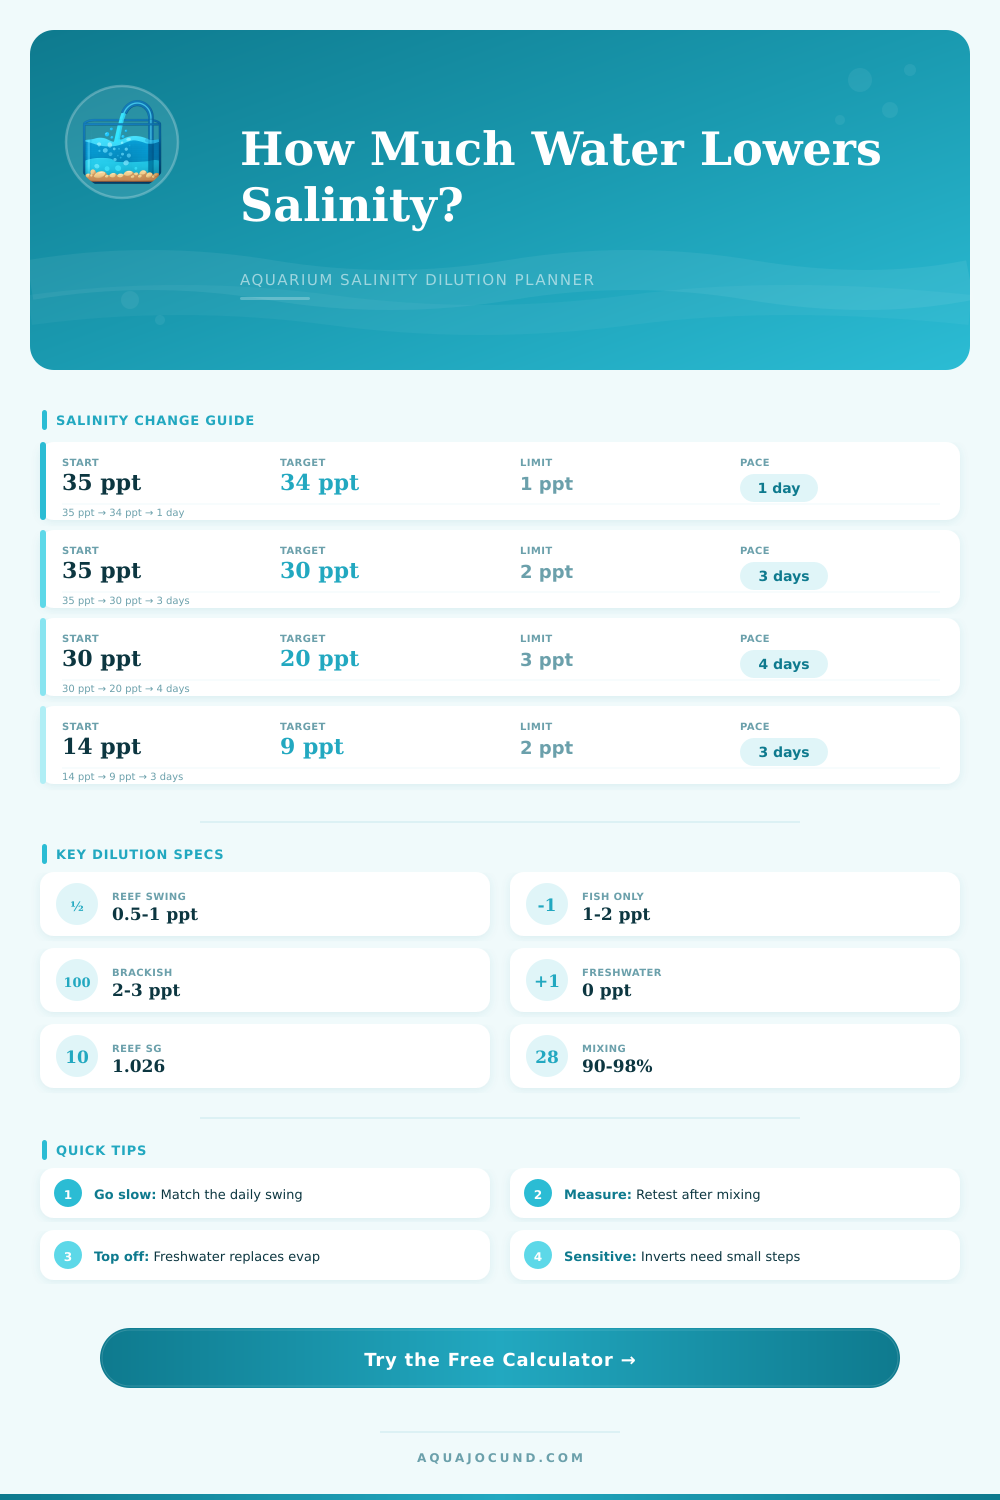
The rate of change depends on how sensitive the livestock are. Certain delicate invertebrates and reef corals simply won’t tolerate much change. Meanwhile, hardy marine fish can handle broader swings (two or three ppt all at once), and brackish water species may make larger leaps toward freshwater goals. For example, peppermint shrimp typically only manage < 1 ppt/day while hardy marine fish will tolerate greater swings in less time.
The calculator’s profiles is set up to recommend gradual increments each day (instead of one huge adjustment) to avoid sudden salt balance shifts which can lead to coral tissue sloughing or fish lethargy. Small thing, big difference when you’re aiming for longevity.
Another variable that is often overlooked is mixing efficiency. Just pouring fresh water into one corner doesn’t immediately homogenize the salinity of the entire system. There are dead zones behind rockwork, slow circulation paths, etc., which can result in very saline water in the overflow box but stable water next to the return pump.
To account for this, the tool has a mixing percentage slider. The lower that number, the longer the timeline or higher the volume estimate. That way you’re not assuming perfect mixing, when it just isn’t going to happen in your particular setup.
Secondly, because instruments change over time (refractometers/hydrometers will provide slightly different readings), there’s some room to test tolerance during the planning phase. Accounting for a slight margin of error prevents you from going too far in either direction because of an occasional bad reading. The plan promotes incremental adjustments, a little here, a little there, instead of major interventions.
If the water’s still kind of salty after your adjustment, well then just top it off with more water. It is hard to take out excess salt from a low-salinity tank without stressing the fish. Be patient and watchful.
You must test again after fully mixed (not as soon as poured on the spot). Early test results can be skewed by sump/rock work delays. In tropical environments, there’s a continual balancing of evaporation vs freshwater top-offs that affects salinity levels. If you know how this works, you’ll tell the difference between true salt accumulation and just evaporative water loss.
It’s really all about understanding what is being measured versus what the animal is experiencing. The numbers tell your hand what to do, but the livestock will tell you whether or not you’re safe. Take your time, use several tests, and trust the water’s circulation to do most of the work.
The delicate balance of the underwater world is best preserved by slow adjustment. Salinity increases gradually, so reversing its effects should always be a gentle, controlled change that honors the capacities of your livestock.