Pond Oxygen Demand by Temperature Calculator
Estimate daily and peak oxygen demand from temperature, pond volume, fish biomass, feed, sludge, and nighttime plant load.
Oxygen demand result
| Profile | Fish O2 at 20°C | Q10 | Sediment O2 | Use case |
|---|---|---|---|---|
| Clear lightly stocked koi pond | 150 mg/kg/hr | 2.0 | 0.25 g/m²/day | Clear water, modest biomass |
| Average koi and goldfish pond | 220 mg/kg/hr | 2.1 | 0.55 g/m²/day | Typical backyard pond |
| Heavily stocked koi pond | 320 mg/kg/hr | 2.2 | 0.85 g/m²/day | Dense fish biomass |
| Goldfish or wildlife pond | 130 mg/kg/hr | 1.9 | 0.35 g/m²/day | Lower feeding pressure |
| Aquaculture growout pond | 450 mg/kg/hr | 2.3 | 1.10 g/m²/day | High feed and fast growth |
| Plant-heavy water garden | 170 mg/kg/hr | 2.0 | 0.55 g/m²/day | Night plant respiration matters |
| Sludge or organic-bottom pond | 190 mg/kg/hr | 2.1 | 1.75 g/m²/day | Leaf litter or old sludge layer |
| New clean pond | 150 mg/kg/hr | 2.0 | 0.15 g/m²/day | Low sediment oxygen demand |
| Water temperature | Approx DO saturation | Relative fish demand | Planning note |
|---|---|---|---|
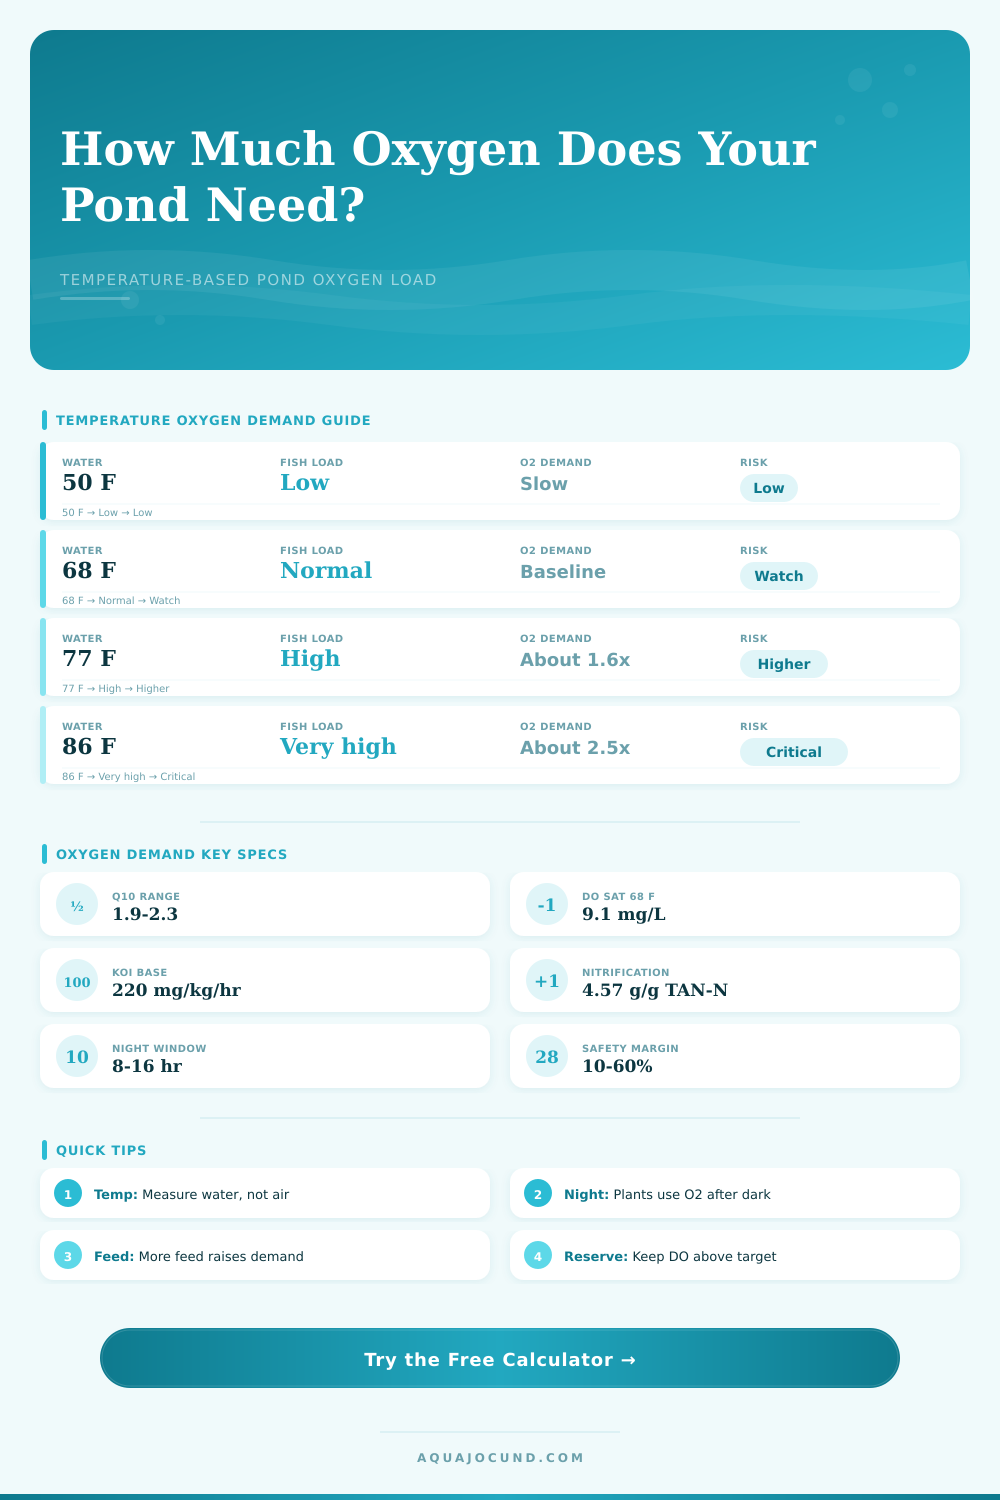
| 41°F / 5°C | 12.8 mg/L | 0.35x baseline | High oxygen capacity, low metabolism |
| 50°F / 10°C | 11.3 mg/L | 0.49x baseline | Fish demand remains reduced |
| 68°F / 20°C | 9.1 mg/L | 1.00x baseline | Reference point used by calculator |
| 77°F / 25°C | 8.3 mg/L | 1.44x baseline | Night and dawn checks become important |
| 86°F / 30°C | 7.6 mg/L | 2.08x baseline | Warm water holds less oxygen while demand climbs |
| Pond example | Dimensions | Approx volume | Typical warm-night demand |
|---|---|---|---|
| Small patio goldfish pond | 6 × 4 × 2 ft / 1.8 × 1.2 × 0.6 m | 360 gal / 1360 L | Low, often under 0.2 lb O2/day |
| Backyard mixed pond | 12 × 8 × 3 ft / 3.7 × 2.4 × 0.9 m | 2150 gal / 8140 L | Moderate fish and feed load |
| Medium koi pond | 16 × 10 × 4 ft / 4.9 × 3.0 × 1.2 m | 4790 gal / 18100 L | High if stocked heavily in summer |
| Round formal pond | 12 ft dia × 3 ft / 3.7 m dia × 0.9 m | 2540 gal / 9610 L | Depends strongly on fish biomass |
| Plant-heavy water garden | 18 × 12 × 2 ft / 5.5 × 3.7 × 0.6 m | 3230 gal / 12200 L | Night plant demand can dominate |
| Factor | Calculator value | Formula role | Practical cue |
|---|---|---|---|
| Fish respiration | mg O2/kg fish/hr at 20°C | multiplied by Q10 temperature factor | Scales directly with fish biomass |
| Nitrification | 4.57 g O2 per g TAN-N | feed protein nitrogen converted to oxygen demand | Higher protein and feed raise filter load |
| Organic feed BOD | 0.20-0.70 g O2 per g feed | represents fines, waste, and dieback pulse | Clean solids capture lowers this term |
| Sediment demand | 0.15-1.75 g O2/m²/day | surface area multiplied by load profile | Leaf sludge increases bottom demand |
| Plant night demand | 0.10-0.65 g O2/m²/night | surface area times coverage and night window | Most visible before sunrise |
Oxygen: Most people think oxygen depletion occur during the heat of summer. It doesn’t; it’s a function of temperature. Warmer water contain less oxygen and the things living in it use up more oxygen due to increased respiration. Fish that breathe faster, bacteria that work harder, and sludge that breaks down more quicky lead to higher demand and lower supply.
The formula above do the math. You just need to know how biology works beneath the numbers. Thermodynamics (the science of heat) is primary culprit. At a water temperature of 68 F, fresh water can holds approximately nine milligrams of dissolved oxygen per liter. When water temperatures reach eighty-six degrees, however, it can only sustain approximately seven and a half milligrams. Not only does the warmer water require your fish to breathe more, it’s making them breathe thinner air.
Why Hot Water Hurts Fish
Metabolism increase by around a factor of two for each ten-degree Celsius rise in temperature. So, for example, your koi will likely be burning twice the oxygen on a hot July evening then they were on a mild spring morning. That’s why the calculator factors in this coefficient. It adjusts the baseline demand to avoid underestimating load when everything seems calm on pond.
Most folks don’t realize how much oxygen is consumed by their filtration system. Ammonia is broken down by nitrifying bacteria, which consume a lot of oxygen in doing so. It takes roughly 4-1/2 grams of oxygen to convert one gram of nitrogen from toxic ammonia into nitrate. High protein diets fed to heavily stocked fish result in a tremendous bacterial load… All day long, every day, not just while you’re watching TV.
You can choose among different pond profiles using this tool as oxygen consumption based off sediment demand is highly variable. Detritus or old leaves may use up oxygen from the bottom, creating a hidden gap that surface aeration alone might not fix. The equation become more complicated with plants. Photosynthesizing aquatic plant will make oxygen during daylight hours. This masks any problems until nighttime. At that time, aquatic plants cease production and begin using up oxygen, similar than fish. Early morning hours can be most dangerous part of your day if you have extensive floating vegetation or water lilies. You could see dissolved oxygen plummeting well before sunrise.
To compensate for this, you can include plant cover in the calculator along with a night demand period. It allows it to calculate when oxygen will hit its low point. Typically right before dawn.
The preset choices will give you a quick idea of where you are. How does a heavily fed koi system compare to a lightly stocked goldfish pond? You’ll see how rapidly the oxygen budget run out. The output provides both peak hour rate of demand as well as daily demand, plus a rough estimate of reserve time left. The lower that reserve figure, the less buffer your pond have for any kind of power outage or storm. That’s a warning sign; either feed less or aerate more.
There’s also a reference table on page that shows how demand and saturation change with temperature. The management of a pond has a lot to do with managing risk. Weather is uncontrollable; you can only manage the load. Cleaning out more sludge, overfeeding less, and having better surface agitation all raise the safety floor for your fish. Your job is to make them as comfortabley as possible in the event the water warms up.
Invisible gases are every bit as important as what you see on the surface. Maintaining that margin of safety turns summer heat into a season of vibrant life instead of threat. You should of realized it would be moddern issues like this.