Planted Tank Redfield Ratio Calculator
Compare nitrate and phosphate as elemental nitrogen and phosphorus, then estimate a dosing or water-change correction for your target N:P balance.
🌿Redfield Balance Presets
📏Water Volume and Test Readings
⚖Target Ratio, Plants, and Algae Pressure
Redfield Ratio Result
🧪Nitrogen and Phosphorus Conversion Grid
📊Nutrient Balance Comparison Grid
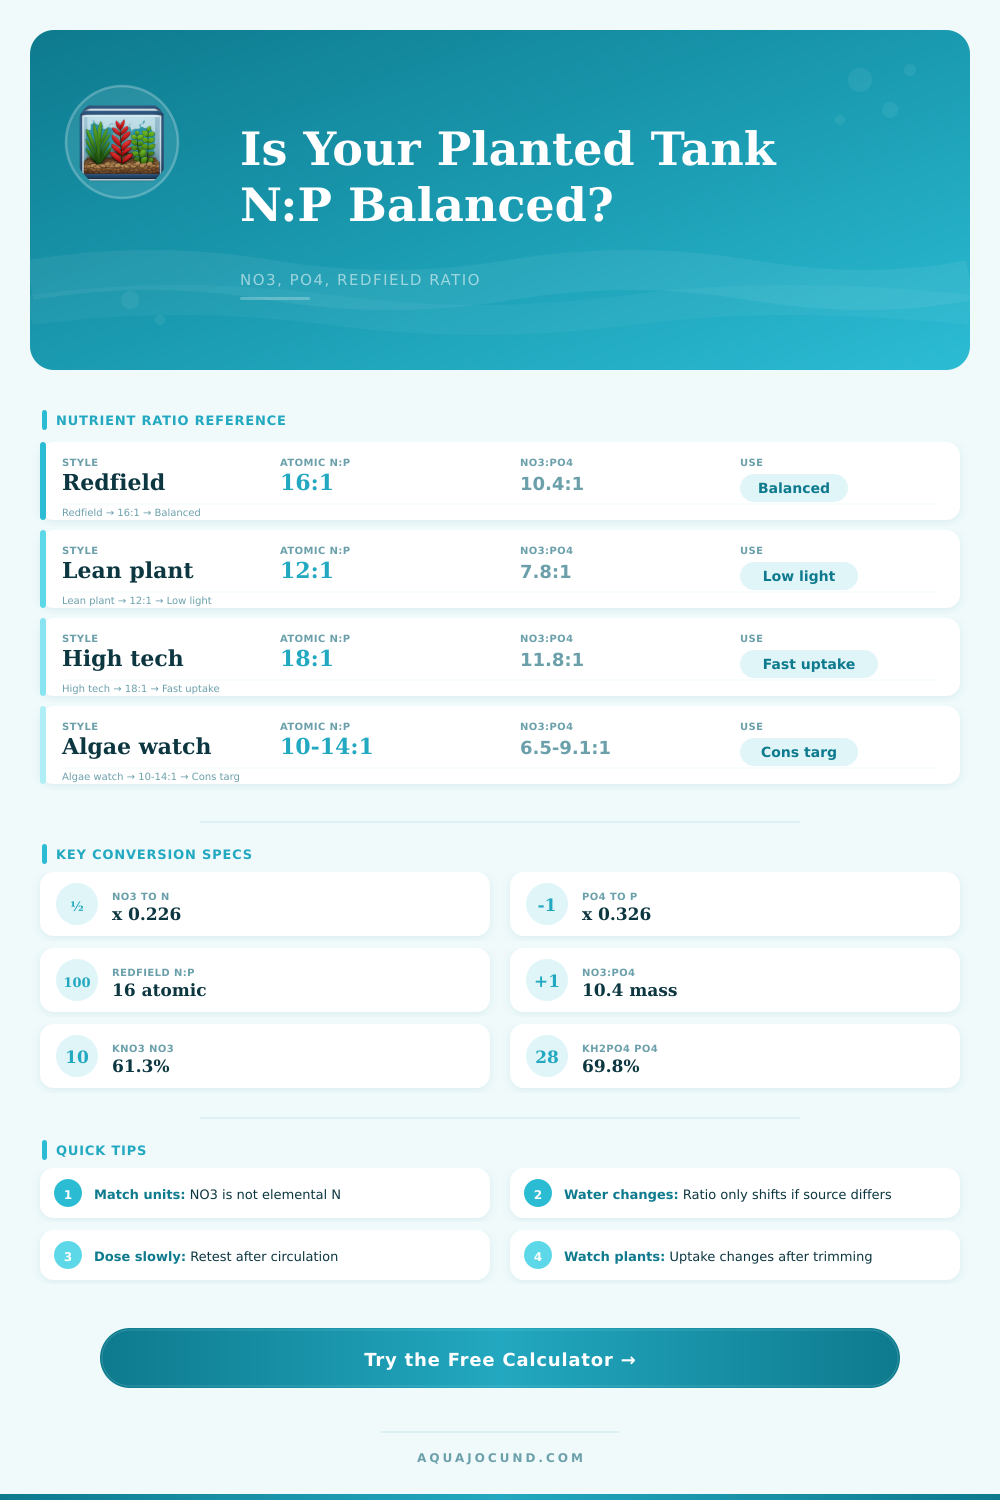
📘Target Ratio Reference
| Target style | Atomic N:P | Equivalent NO3:PO4 | Typical planted tank use |
|---|---|---|---|
| Lean low tech | 10-12:1 | 6.5-7.8:1 | Slow growth, low light, modest dosing |
| Classic Redfield | 16:1 | 10.4:1 | General reference for nutrient balance |
| High tech stem tank | 18-20:1 | 11.8-13.1:1 | Fast nitrate uptake with stable CO2 |
| Cyanobacteria watch | 14-18:1 | 9.1-11.8:1 | Avoid very low nitrate relative to phosphate |
| Phosphate-heavy reset | 12-16:1 | 7.8-10.4:1 | Use after rich feeding or active soil release |
🔬Dosing Source Conversion Table
| Source | Main nutrient fraction | Side addition | Best calculator use |
|---|---|---|---|
| KNO3 potassium nitrate | 61.3% NO3 | Adds about 0.63 ppm K per 1 ppm NO3 | Raising low N:P safely |
| Calcium nitrate tetrahydrate | 52.5% NO3 | Adds about 0.32 ppm Ca per 1 ppm NO3 | Potassium-sensitive setups |
| KH2PO4 monopotassium phosphate | 69.8% PO4 | Adds about 0.41 ppm K per 1 ppm PO4 | Raising high N:P tanks |
| Liquid nitrate label | Uses label strength | Depends on bottle formula | Small tanks or pump dosing |
| Liquid phosphate label | Uses label strength | Depends on bottle formula | Fine phosphate corrections |
📏Common Tank Size Correction Amounts
| Tank | Working volume | 1 ppm NO3 as KNO3 | 0.1 ppm PO4 as KH2PO4 |
|---|---|---|---|
| 10 gallon | 38 L | 0.062 g | 0.005 g |
| 20 long | 76 L | 0.123 g | 0.011 g |
| 29 gallon | 110 L | 0.179 g | 0.016 g |
| 40 breeder | 151 L | 0.246 g | 0.022 g |
| 55 gallon | 208 L | 0.339 g | 0.030 g |
| 75 gallon | 284 L | 0.463 g | 0.041 g |
🌱Plant Density and Algae Pressure Guide
| Tank condition | Estimated NO3 uptake | Estimated PO4 uptake | Adjustment note |
|---|---|---|---|
| Sparse rhizomes | 0.3 ppm/day | 0.03 ppm/day | Use smaller correction strength |
| Low tech mixed | 0.7 ppm/day | 0.07 ppm/day | Ratio changes slowly |
| Moderate stems | 1.4 ppm/day | 0.14 ppm/day | Test before weekly water change |
| Dense planted | 2.5 ppm/day | 0.25 ppm/day | Uptake can shift after trimming |
| High tech carpet | 4.0 ppm/day | 0.40 ppm/day | CO2 stability matters as much as ratio |
Remove one of those strips from your test kit in the planted tank and what do you have? It is a snapshot of chemical tension. It is not just clean or dirty water but balance. Not just the amount of ammonia, nitrite, nitrates and phosphate, but their relationship with each other. That relationship; the ratio of nitrate to phosphate, influences how well stem plant will grow versus how much algae covers glass.
One basic measurement of that balance is so-called Redfield ratio, which originated in marine biology but can apply to freshwater aquariums also. In brief, it’s an atomic balance: 16 parts nitrogen to 1 part phosphorus. Sounds easy enough, except your test kit doesn’t report on atoms. At first, most hobbyists fail to understand what is happening. Your phosphate test result is PO4, while your nitrate test results are NO3. Add those oxygen atoms. Plants don’t eat that mass. Don’t try comparing phosphates to nitrates directly; it’s not a fair comparison.
How to Balance Nutrients in Your Aquarium
Once you input your existing test results along with your tank size, the calculator above do all the math for you. No more guessing at conversion factors or misinterpreting slightly elevated numbers as imbalances. The calculator subtracts amount of oxygen and lets you know exactly how many nutrients are in your water. Once you understand this conversion, dosing fertilizers makes sense. You’ll know that slow growth isn’t caused by having too much Nitrogen, because your nitrate level is high; it’s because of low Phosphate. What do you do then? Adding more Nitrogen won’t help. Instead, it would only feed the algae that thrive on excess nutrients they can dump into the environment when there’s insufficient light and/or carbon.
Because the tool calculates amount of water displaced by hardscape and substrate, you also know the suggested correction dose is safe even for fish/shrimp. A 10 gallon nano cube doesn’t behave like a 75 gallon breeder when exposed to the same concentration change. In small tank, doubling your error could be catastrophic, whereas in the larger tank, you might not notice the problem for weeks until plants turn yellow.
Raw numbers frequently fail to account for another key factor: plant density. Under high lights, a dense carpet of dwarf hair grass removes nutrients faster than a sparsely planted moss aquascape. Nitrate will get pulled down to zero in 24 hours if you don’t dose every day. That’s because fast-growing stems functions as vacuum cleaners. Testing at the wrong time of day can skew your results because rapid nutrient uptake can make it appear as if your nitrates are lower than actualy.
To account for this biological demand, the calculator has inputs for algae pressure and plant density. These variables show that how quickly nutrients move through the system is more important then any static ratio. You’re feeding living things with variable appetites that depend on lighting cycles and other factors such as their health. The other wrinkle is water changes. You refill your tank with tap water. Which may have trace amounts of phosphate and nitrate. Without knowing it, you can affect your ratio each week by refilling with tap water. For example, let’s say your source water has a lot of Nitrogen in it due to nearby runoff. A regular 20 percent water change would actually increase your N:P ratio. This means you’re starving your plants for phosphorus if they were already short on this element.
The tool factors in this change based off your tap water settings, and shows you how much you will change your ratio by when you clean the tank. So you know to account for this adjustment in your dosing. What was once just a routine task becomes a strategic one. Perfection isn’t the aim. This is simply a guideline (not a law).
Lower ratios in the 10 to 12 range are generally fine for low-tech tanks that experience less light and have fewer issues with nuisance algae. Higher ratios up to 16:1 may be achievable in high tech tanks where the CO2 level keeps plants photosynthesizing at sufficient rates to remove all of the excess nitrate. To match your expectations to your hobby style, the page has reference tables that break them out into those kinds of styles. If your lighting and tank design require a balance outside the Redfield ideal, don’t feel compelled to pursue it.
There’s no substitute for observation in testing. You use the numbers to determine your current status, but the plant will show you its future. Get your basic dosing from the calculator, but observe the leaves. Are there strong, growing roots? Is there vibrant new growth? Your ratio is correct, even if it isn’t exactly the ideal according to the chart. Chemistry serves biology, not the other way around. Let the plants lead you to a balance where growth exceeds decay. And keep those nutrients flowing and the water moving.