Planted Tank Nitrate Uptake Calculator
Estimate plant nitrate uptake from starting and ending nitrate, test days, tank volume, plant biomass, light, CO2, fish input, fertilizer, and water change correction.
📌Planted Tank Presets
🧪Nitrate, Biomass, And Water Change Inputs
Use true water volume after substrate, hardscape, filter, and sump displacement.
Use visible wet plant mass or harvested trim mass as the comparison basis.
Use measured no-change nitrate rise, or estimate from stocking and feeding.
Harvested plants remove stored nitrogen; heavy trimming can make uptake look lower afterward.
📊Live Uptake Benchmarks
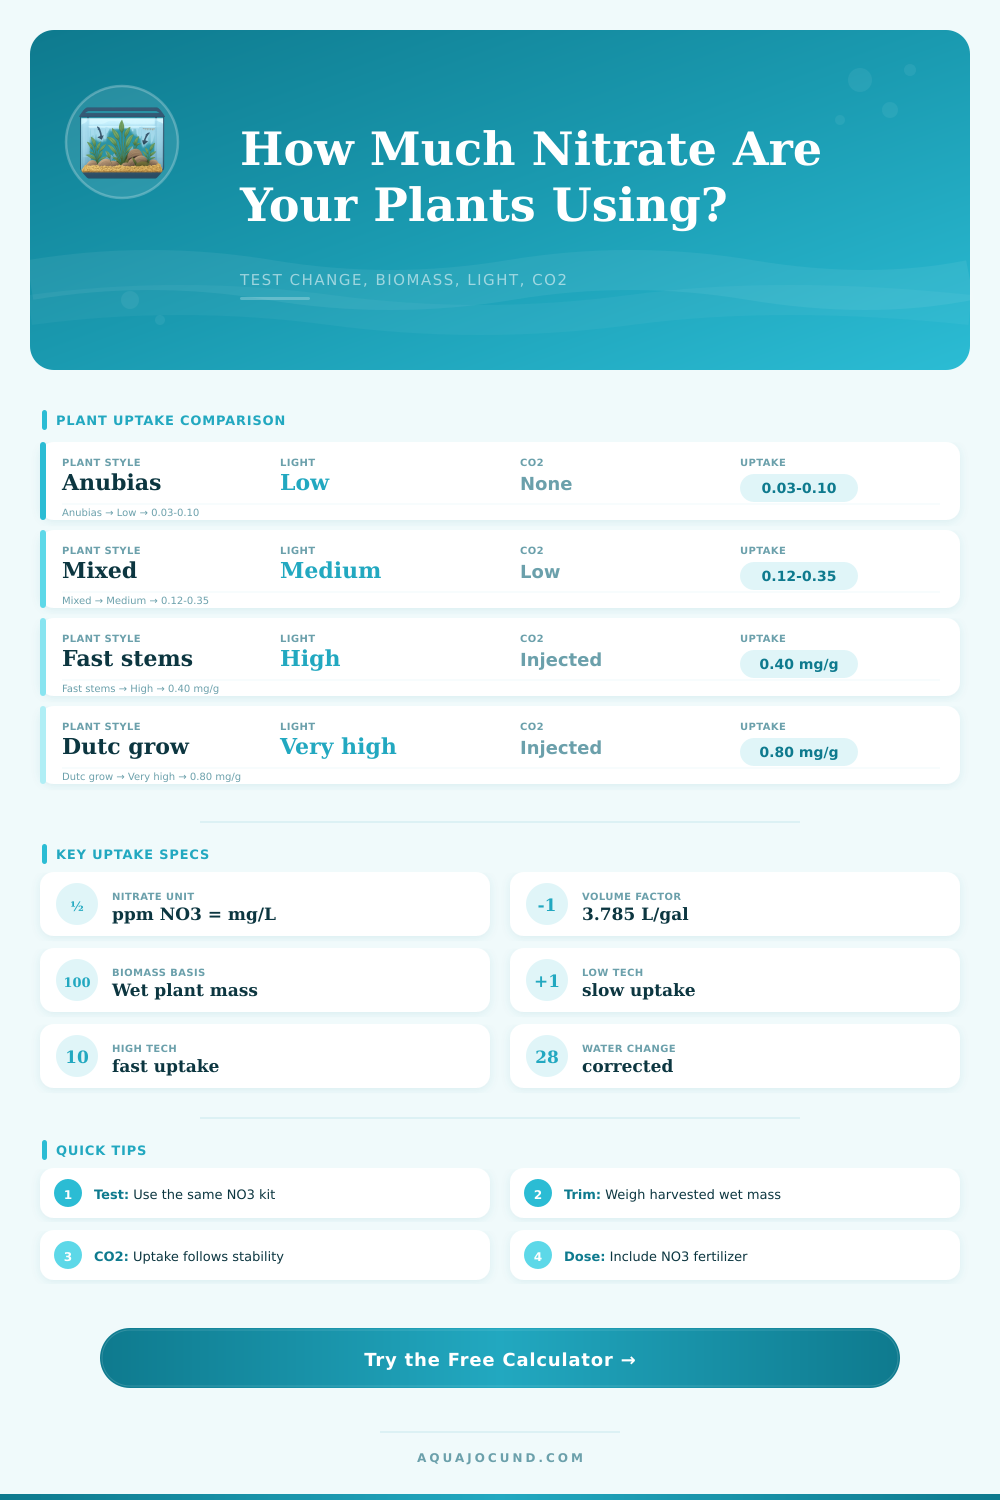
🌱Plant-Growth Uptake Comparison Grid
Slow Epiphytes
Anubias, Java fern, moss, and shaded rhizome tanks.
0.03-0.12 mg/g/dayRooted Rosettes
Crypts, swords, vals, and soil-fed growth with moderate leaf turnover.
0.08-0.25 mg/g/dayMixed Community
Typical planted display with stems, moss, rosettes, and regular trimming.
0.15-0.45 mg/g/dayFast Stems
Rotala, Hygrophila, pearl weed, and similar fast nitrate users.
0.35-0.95 mg/g/dayCarpet Tank
Low-growing plants with strong light, CO2, and dense substrate coverage.
0.25-0.75 mg/g/dayFloating Harvest
Salvinia, frogbit, duckweed, and red root floaters removed weekly.
0.45-1.20 mg/g/dayDutch Style
High plant density, stable CO2, rich dosing, and frequent trimming.
0.60-1.40 mg/g/dayGrow-Out Tray
Plant farm or holding tank where biomass gain is the main goal.
0.80-1.80 mg/g/day📋Plant Profile Reference
| Profile | Expected Uptake | Common Plants | Reading Caution |
|---|---|---|---|
| Epiphytes and moss | 0.03-0.12 mg/g/day | Anubias, Java fern, Buce, moss | Rhizomes grow slowly even with clean water |
| Crypts and rooted rosettes | 0.08-0.25 mg/g/day | Cryptocoryne, swords, vallisneria | Root tabs and substrate nitrogen may mask water uptake |
| Mixed community | 0.15-0.45 mg/g/day | Stems, rosettes, moss, floaters | Use a broad range unless biomass is weighed |
| Fast stems | 0.35-0.95 mg/g/day | Rotala, Hygrophila, Limnophila | Post-trim regrowth can spike uptake |
| Carpet focused | 0.25-0.75 mg/g/day | Monte Carlo, hairgrass, HC, Lilaeopsis | CO2 at substrate level matters more than surface ppm |
| Floating harvest | 0.45-1.20 mg/g/day | Salvinia, frogbit, duckweed | Shading can slow submerged plants |
| Dutch style | 0.60-1.40 mg/g/day | Dense stems and color groups | Needs consistent macros, micros, CO2, and pruning |
| High biomass grow-out | 0.80-1.80 mg/g/day | Farm tubs, emersed transition, trimmings | Measured biomass changes quickly |
☀Light And CO2 Multiplier Guide
| Condition | Multiplier | Typical Sign | Calculator Use |
|---|---|---|---|
| Low light, no CO2 | 0.45-0.65 | Slow but steady leaves | Expect a low match unless floaters dominate |
| Medium light, no CO2 | 0.65-0.90 | Moderate growth with algae risk if nutrients swing | Good default for low-tech community tanks |
| Medium light, low CO2 | 0.90-1.10 | Visible pearling after water changes | Useful bridge between low and high tech |
| High light, stable CO2 | 1.20-1.55 | Fast stems need weekly trimming | High uptake should match visible growth |
| Very high light, rich CO2 | 1.55-1.95 | Daily visible growth and heavy pruning | Only use if CO2 and macros stay stable |
💧Water Change Correction Examples
| Tank | Interval | Change Correction | Why It Matters |
|---|---|---|---|
| 10 gal / 38 L low tech | 7 days | 20% once, 2 ppm source | Small changes hide a little nitrate removal |
| 20 gal / 76 L mixed tank | 7 days | 30% once, 5 ppm source | Common weekly routine needs correction |
| 40 breeder high tech | 7 days | 50% once, 3 ppm source | Large changes can remove more nitrate than plants |
| 60P aquascape | 6 days | 40% once, 0 ppm source | Lean replacement water makes uptake easier to see |
| Plant grow-out tank | 10 days | 25% twice, 5 ppm source | Multiple events compound dilution and source nitrate |
📏Common Planted Tank Biomass Ranges
| Tank Size | Lightly Planted | Moderately Planted | Heavily Planted | Best Use In Calculator |
|---|---|---|---|---|
| 5 gal / 19 L | 1-2 oz / 30-60 g | 2-5 oz / 60-140 g | 5-9 oz / 140-255 g | Nano shrimp and moss tanks |
| 10 gal / 38 L | 2-4 oz / 60-115 g | 5-10 oz / 140-285 g | 10-18 oz / 285-510 g | Low-tech displays |
| 20 gal / 76 L | 5-9 oz / 140-255 g | 10-22 oz / 285-625 g | 22-40 oz / 625-1135 g | Mixed community tanks |
| 40 breeder / 151 L | 10-18 oz / 285-510 g | 24-45 oz / 680-1275 g | 45-80 oz / 1275-2270 g | Stem and carpet layouts |
| 75 gal / 284 L | 20-35 oz / 565-990 g | 45-85 oz / 1275-2410 g | 85-150 oz / 2410-4250 g | Large nature or Dutch tanks |
When you use nitrate tests it’s frequently just a yes/no indicator of whether everything’s okay. If it’s low and the water appears clear then there must be no problem, right? The fish aren’t producing any more than the plant can absorb, so it must be okay. That sounds good and seems like it should of been fine.
But the truth is that plants don’t remove nutrients at a steady pace. Plants pick up in daylight hours but sits dormant at night. Trimming them surges uptake while dimming light slow down intake. A single test value doesn’t indicate much about nutrient movement during the days, nights, weeks, etc., since you last tested. To be certain whether plants is catching up with waste generation requires some insight into the movement of nutrients within your particular tank system.
Understanding How Plants Remove Nitrates
What happens next? We capture that movement in time. The beginning of process involves taking a measurement right after a water change, once everything has stabilized. Then we sit on our hands for a few days, allowing things to operate as usual, dosing, feeding, etc. Why the waiting period? Because it helps eliminate random day-to-day peaks and reveals actual removal trends.
At end of the waiting period, you simply input your starting and ending values, the tank size, and the number of tests into the tool, and system computes net drawdown. It filters out all the random noise and tell you exactly how much nitrate was removed from the water throughout that period. This is where most hobbyist fail. They only test when it comes to mind.
But how do we measure this? Well, one way is to extract all the plants from the tank then weigh them. Few people are willing to sacrifice their aquascape by doing that. An easier solution is to weigh what you trim (or harvest) on a regular basis. Let’s say you remove four ounces of rotala per week. That is only part of total plant matter in your tank.
So the calculator treats the amount of biomass you’re harvesting as a proxy for how densely planted your tank is. Then it will normalize nitrate uptake by that harvested mass, allowing you to compare how efficiently each gram of plant cleans up water. Without considering this factor, you would unfairly compare a sparsely planted tank different than a very heavily planted tank based solely on raw ppm numbers.
This bio-chemical process are multiplied by light and CO2. Even if you overdose with fertilizers, plants won’t use up all the nitrate very fast unless they’re growing under sufficient light. The table on page shows the difference between slow uptake rate of epiphytic plants and a high tech Dutch set-up. Adding CO2 via injection alters things since it removes the bottleneck that slows down the plant’s ability to photosynthesize. Without adequate carbon, excess nitrate will hang around, and algae will fill the gap. Understanding what “zone” your tank falls into, i.e., low or high multiplier, goes a long way towards understanding why you may see no change in test results but still have visible growth.
The numbers get a lot more complicated with water changes. When you change out 30% of your water halfway through the test, you reduce the nitrates without involving any plants at all. The calculator takes that into account (it factors in how much water you replaced and quality of your source water). It computes what the nitrate concentration would’ve been assuming that you didn’t change any water, so it separates biological uptake from mechanical dilution. Why? Because knowing this will tell you if your plants did anything to process nitrates, or if you’re simply washing them down the drain.
The final piece is the inputs: what we add to the system. This includes both fertilizer dosages and fish input. Match the amount of nitrate that rises from food and fish waste with the amount that drops from water changes and plant uptake. This will help the tank stabilize. That means when those two match, your tank levels out.
If you’re planting well but nitrates still steadily rise, then you have a problem delivering enough CO2/light. If they constantly crash all the way to zero, you probably aren’t fertilizing enough and risk starving your plants. Or, you’re feeding WAY to much, which results in excess nutrient loss. Understanding equilibrium gives you a framework to turn guesswork into focused tank care.