Planted Tank CO2 Bubble Rate Calculator
Estimate a starting CO2 bubble rate from tank volume, KH, current pH, target pH, diffuser efficiency, plant demand, photoperiod, and livestock safety.
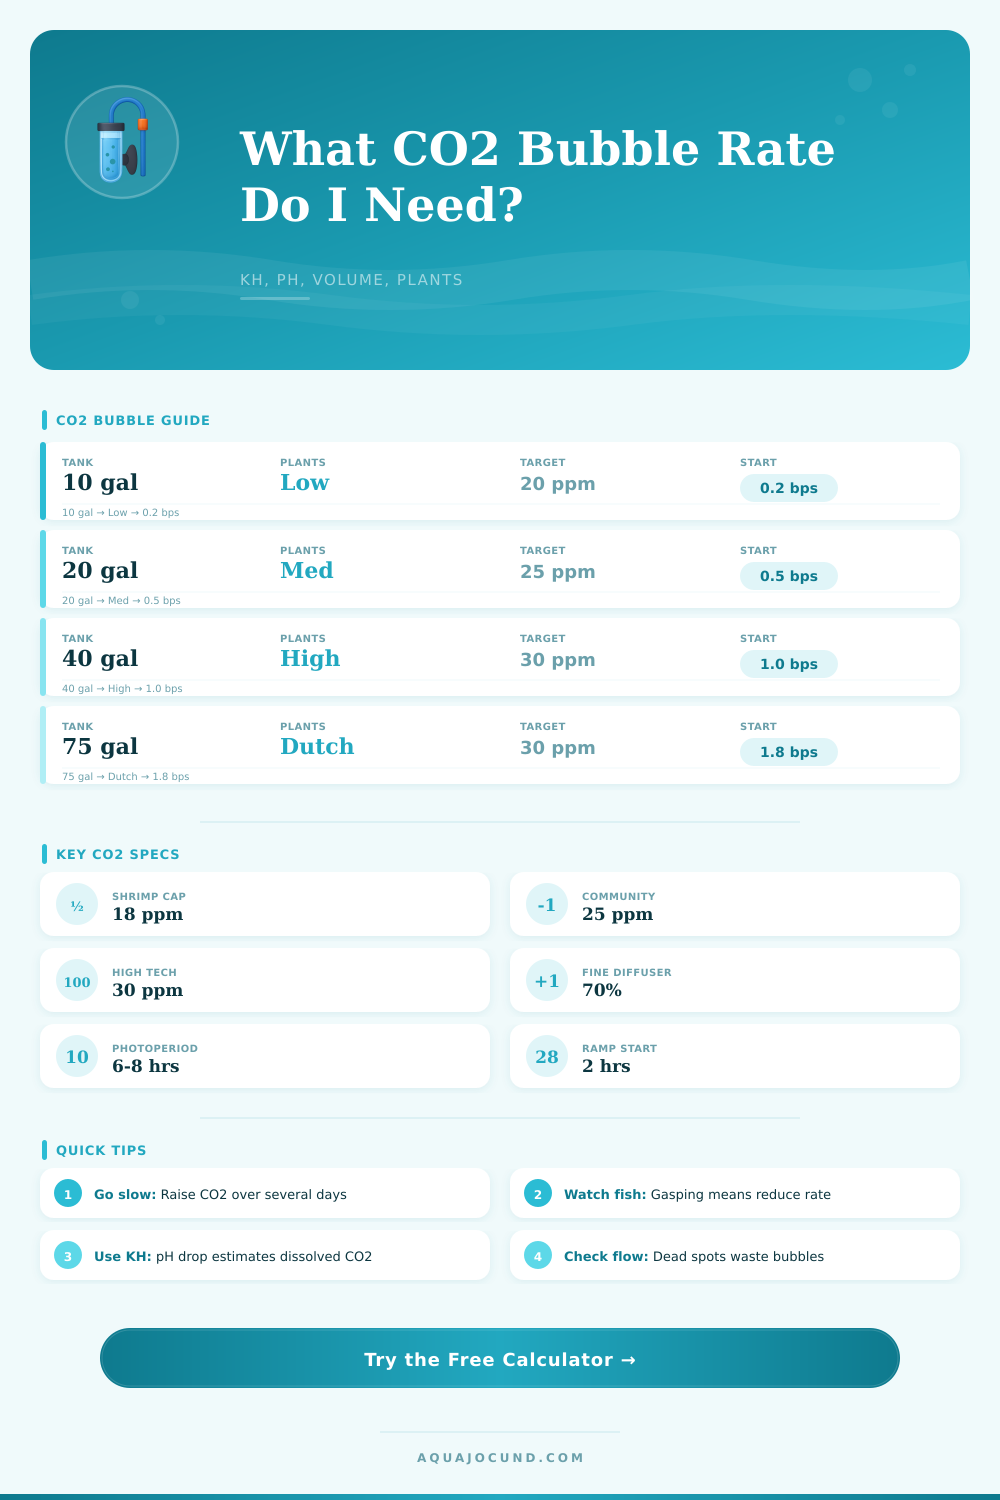
🌿Planted Tank Presets
📐Tank Volume and CO2 Inputs
CO2 Bubble Rate Estimate
⚙CO2 Method Comparison Grid
📊KH and pH CO2 Reference
| KH | pH 7.0 | pH 6.8 | pH 6.6 |
|---|---|---|---|
| 2 dKH | 6 mg/L | 9 mg/L | 15 mg/L |
| 4 dKH | 12 mg/L | 19 mg/L | 30 mg/L |
| 6 dKH | 18 mg/L | 28 mg/L | 45 mg/L |
| 8 dKH | 24 mg/L | 38 mg/L | 60 mg/L |
💧Diffuser and Reactor Efficiency
| CO2 method | Typical absorption | Best fit | Bubble rate effect |
|---|---|---|---|
| Ladder or bell | 30-40% | Nano and low flow tanks | Needs more bubbles |
| Ceramic disc | 45-60% | Small to medium tanks | Good starting point |
| Fine mist diffuser | 65-75% | High flow planted tanks | Lower visible count |
| Inline atomizer | 75-85% | Canister filter systems | Efficient but misty |
| External reactor | 85-95% | Large displays | Lowest bubble count |
🐟Livestock CO2 Safety Ranges
| Livestock profile | Soft cap | Watch behavior at | Best adjustment |
|---|---|---|---|
| Shrimp and sensitive fish | 18 mg/L | 15-20 mg/L | Increase very slowly |
| Community planted tank | 25 mg/L | 25-30 mg/L | Use surface ripple |
| Hardy fish with flow | 30 mg/L | 30-35 mg/L | Check first hour |
| Experienced high-tech | 35 mg/L | 35+ mg/L | Use drop checker plus behavior |
| Fishless grow-out | 40 mg/L | Plant stress only | Focus on pH stability |
📏Common Tank Starting Ranges
| Tank size | Dimensions | Volume | Typical start |
|---|---|---|---|
| 10 gallon | 20 x 10 x 12 in / 51 x 25 x 30 cm | 38 L | 0.1-0.3 bps |
| 20 long | 30 x 12 x 12 in / 76 x 30 x 30 cm | 76 L | 0.3-0.7 bps |
| 40 breeder | 36 x 18 x 16 in / 91 x 46 x 41 cm | 151 L | 0.7-1.5 bps |
| 55 gallon | 48 x 13 x 21 in / 122 x 33 x 53 cm | 208 L | 1.0-2.0 bps |
| 75 gallon | 48 x 18 x 21 in / 122 x 46 x 53 cm | 284 L | 1.5-3.0 bps |
| 125 gallon | 72 x 18 x 21 in / 183 x 46 x 53 cm | 473 L | 2.5-5.0 bps |
Remember the time you set up a new tank, fired up the CO2 system and anxiousy stared at the bubble counter? Is it too much gas… is it too little? Are you gassing out your fish or not enough? It’s a real struggle for us hobbyists because we want those lush carpet of plants AND we care about our livestock. That’s where this calculator comes into play.
It do all kinds of complex math involving volume, KH, and target pH values so you can stop guessing and start dialing in with confidence. One of the largest misconceptions is that bubbles = dissolved CO2. Nope. Bubbles is simply a visual sign of the rhythm of your regulator. What matters is that enough gas stays in the water long enough to reach and be absorbed by leaves or roots. That’s where efficiency of diffusers becomes relevant. While a cheap ladder type diffuser may waste half your gas up out of top surface. An inline reactor/ceramic disc type with a fine mist will capture a lot more. The tool take this into account by asking about the hardware you’re using. In effect, it adjust the bubble count to your true absorption rate. This isn’t simply counting air escaping into the room.
How to Use This CO2 Calculator Safely
Another reason is chemistry. Even though you may have a very powerful regulator and it’s all the way open, high carbonate hardness will restrict pH drop. High KH mean the pH won’t drop more with the same amount of gas injected. To find out what chemical position is, the calculator relies on the traditional KH-pH-CO2 relationship. It goes beyond the eye test. Enter your current KH and target pH and it calculate probable dissolved CO2 in parts per million. This avoids the trap so many folks run into. They often think they’re running low flow just because there isn’t a lot of bubbling. Your hardness buffer the acidity beautifuly. Trust the chemistry more than how it looks.
To get started, you need a light touch here when it comes to livestock safety. Sensitive tetras don’t like sudden changes, neither do shrimp. For this reason, the tool recommends beginning with a lower percentage of the max possible value. That will give the tank resident time to get used to it. That’s your ramp up plan. And here’s the deal, you must use a ramp-up strategy to keep your inhabitants alive. Monitor them for several days. Be observant. Don’t be afraid to turn it down if you notice fish hovering around bubble outlets or gasping at the water’s surface. You would of pushed it too hard. Slow it way down. What you’re after is something in the middle, something steady that won’t stress the animals but will be just enough to make the plants happy.
The demand of plants depends highly off their style and hardscape. Anubias and pothos in a low-tech tank require almost no injection whatsoever. Fast growing stem plants under intense light, however, will eat CO2 like candy throughout the day. Especially when aiming for a dense Dutch aquascape, those plant consume it like crazy. This is why the calculator account for that biologic load. Higher demand mean higher concentration. Your plants won’t be able to catch up to photosynthesis otherwise and algae will soon take over where they left off. Keeping the injection rate proportional to amount of plants keeps this bottleneck away.
Many don’t realize how much water movement matter. CO2 pockets will not be distributed to the plants when there are dead spots in your tank. A good flow distribute it evenly. For example, if you use HOB (hang-on-back) filters and get huge surface agitation, then you’re degassing your water all the time. You need to inject more to make up for this. The tool takes general setup variables like these into account, but you should still look for any dead spots visually.
In summary, then, the number is a beginning figure, but not a commandment. Aquascaping is an inductive process. Monitor it. Use the number as a starting point and use the drop checker as a secondary visual guide alongside it. If it’s red, your CO2 levels are correct. Yellow? Then your co2 levels are too low. Blue? Dangerous! Fish out of water.
Plants drooping? Livestock looking restless? Match those visual cues to chemical readings. Change gradually. Take weeks, not days. When all goes well, your plants will be growing at an acceptable pace, there should be no algae, and your fish will seem completely oblivious to the invisible gas feeding their underwater garden. Go easy, pay attention, and follow the chemistry. Don’t make the chemistry follow your will.