Phosphate Steady State Calculator
Estimate where aquarium PO4 will settle from daily input, feeding source, export, water changes, and phosphate media.
| Source | Typical P Basis | Availability | Best Use |
|---|---|---|---|
| Direct test estimate | Observed ppm/day | 100% measured | Best when testing same time daily |
| Dry fish food | 0.8-1.6% P | 15-35% | Freshwater community feeding |
| Frozen food | 0.3-1.0% P | 10-25% | Reef or predator tanks |
| Coral powder | 1.0-2.0% P | 25-60% | Small frequent reef feeding |
| Fertilizer dose | Label ppm PO4 | 100% | Planted tank phosphate dosing |
| Removal Path | Calculator Input | Model Treatment | Steady-State Effect |
|---|---|---|---|
| Plants, algae, refugium | Daily export % | First-order removal | Higher percent lowers final ppm |
| Skimming and detritus export | Daily export % | Current-level proportional | Most visible with steady feeding |
| GFO, resin, lanthanum plan | Media ppm/day | Fixed daily drawdown | Offsets part of the daily input |
| Water changes | Percent and interval | Equivalent daily dilution | Shorter intervals reduce average ppm |
| Schedule | Equivalent Daily Dilution | Half-Life From WC Only | Use Case |
|---|---|---|---|
| 10% weekly | 1.51%/day | 46.0 days | Lightly fed planted tank |
| 25% weekly | 4.11%/day | 16.9 days | Community or mixed reef |
| 50% weekly | 9.90%/day | 7.0 days | EI planted dosing reset |
| 15% twice weekly | 4.64%/day | 14.9 days | Stable nutrient control |
| Tank | Nominal Volume | Metric Volume | 0.02 ppm/day PO4 Mass |
|---|---|---|---|
| 10 gallon | 10 gal | 37.9 L | 0.76 mg/day |
| 20 long | 20 gal | 75.7 L | 1.51 mg/day |
| 40 breeder | 40 gal | 151 L | 3.03 mg/day |
| 75 gallon | 75 gal | 284 L | 5.68 mg/day |
| 125 gallon | 125 gal | 473 L | 9.46 mg/day |
Suddenly your phosphate level begin to creep back up again. You look at water parameters in your tank. Again? How did that happen? Everything has been the same for the past month; I didn’t change anything! But then you remember the numbers has fluctuated some each day, a little too much for comfort. Is that normal biological noise? Or are you actualy making a difference? This is where idea of steady state can be helpful. It gives you a better picture than reading one daily test result alone ever could.
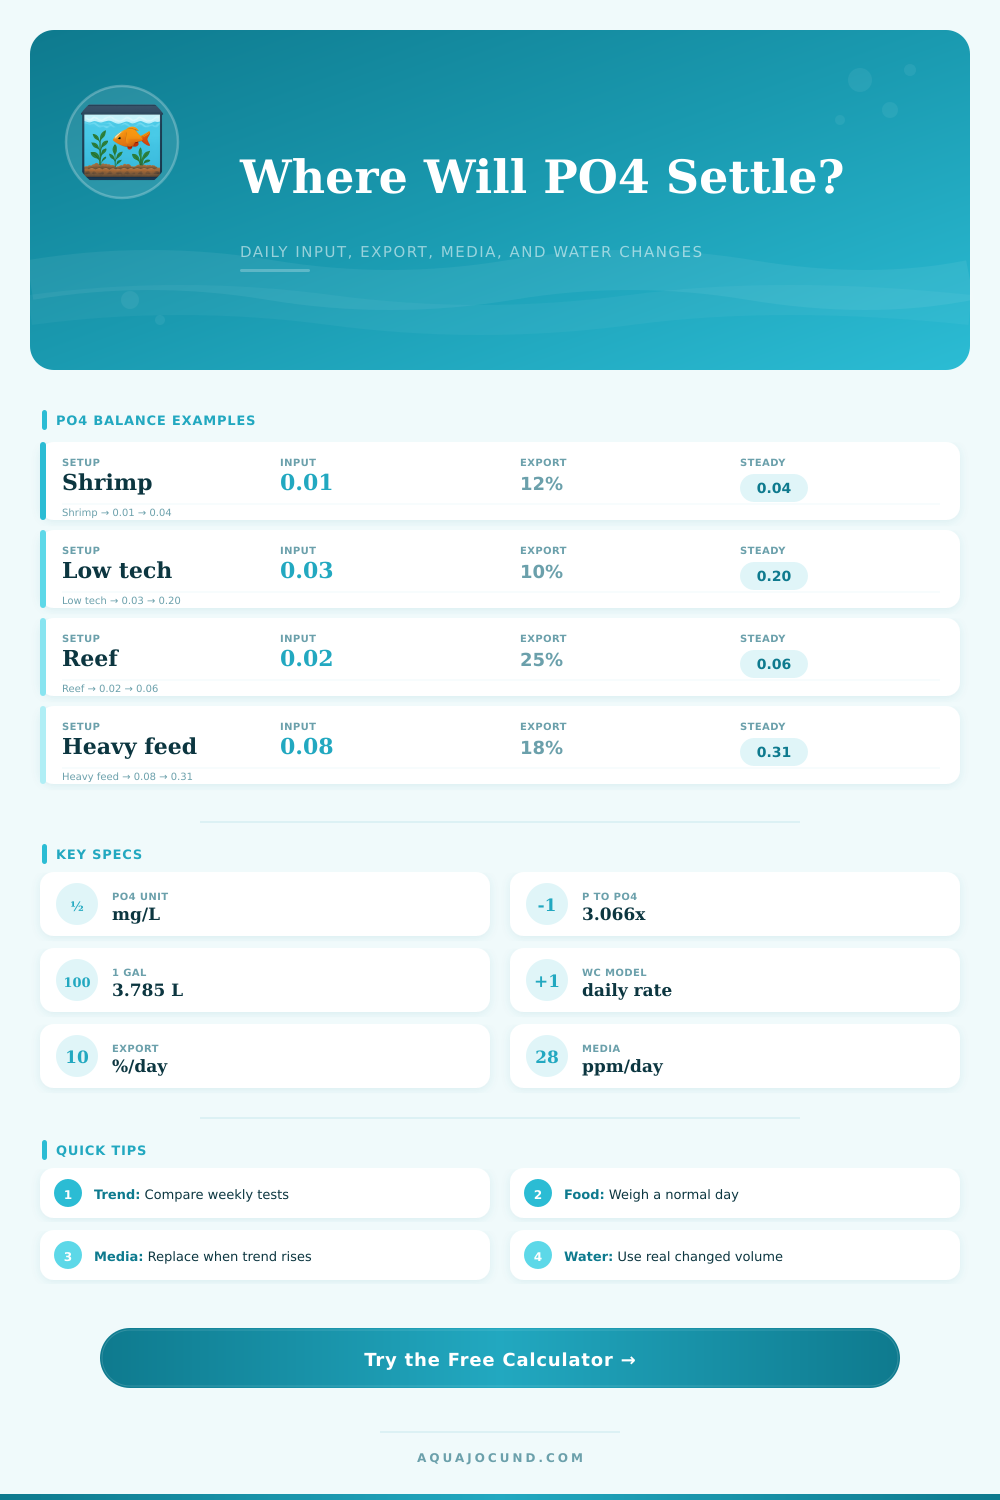
The calculator above models this balance, balancing out your daily input with all known removal pathways in your system. These include water changes and consuming media. In essence, it help predict where your phosphate will end up when your tank finally settles. It avoids buying needless product and saves you weeks of guessing.
What is Steady State?
Phosphate also isn’t created from thin air and doesn’t dissapears magically. Water sources (e.g., tap water), food, and/or any fertilizer dosing contribute to it. Scrubbing with algae, plant uptake, physical water changes/exchanges, and filtering with something like granular ferric oxide remove it. And here’s the catch, none of this occur at uniform rates.
Even if a flake has an amount of phosphorus listed on the bag when dry, not all of that phosphate will dissolve within column of water. Some will sink to the bottom, rotting away in the substrate. Some will be consumed by fish. Only a fraction of it actualy goes toward causing whatever measurable phosphate “spike” your water column experience. So the calculator let you dial in the availability percentage based off how you feed. You won’t assume that every gram of food translates into direct chemical surge.
Many aquarists grossly underestimate amount of stuff they put in and grossly overestimate how much they can take out. For example, many believe that addition of a refugium or heavy skimming will make everything right. But the fact is that most biological removal occur at a rate proportional to what’s currently in there. The more phosphate you have, the more you’ll remove each day. As it decreases, the rate of removal also decrease at that same rate.
This results in a self-imposed floor beneath which it becomes extremely hard to push any lower than resorting to forceful mechanical means. Knowing this first-order removal logic goes a long way toward understanding why it may be useless trying to chase after zero phosphate. Doing so can result in tanks with unhappy livestock and tank instability.
This is also where the “change less” part come in. A single huge 50% change per month sounds really good, but it keeps your tank running full-tilt for three weeks out of every four. Smaller partial changes more frequently will result in a gentler average load on your tank and yield better long-term stability than doubling your media budget. The dilution rate comparison chart in the tool breaks this down to compare equivalent daily dilution rates, showing how schedule changes impact the overall half-life of phosphate in your tank. This compares different schedules and shows you how they affect the overall half-life of phosphate in your tank.
Often it’s a simple tweak to when you make your changes that leads to improved long term stability compared to making double the investment in media. GFO is also a limited resource; it binds phosphate from the water until all of the binding sites are filled. Then it’s dead, unable to bind any more and even capable of releasing some of what was bound back into the column if you don’t keep an eye on it. The calculator assumes a fixed amount of drawdown per day with fresh GFO. That means you has to tell the calculator how long you’ve had your GFO in there. When the model predicts everything should of be stable but you see your test values creeping up anyway, chances are your GFO is depleted. That’s when most setups go astray… Because the model is telling you something different than reality.
This is the bottom line on controlling phosphates. Controlling phosphates is not so much about eradicating all of it as it is maintaining it within a manageable ceiling. That means keeping algae away while feeding enough for your plants or beneficial microbe. Plugging in your actual media usage, water change schedule, and feeding weight allows you to go from panic mode (reactive) to planning mode (proactive). Instead of guessing what happened when the numbers changed, you are able to understand the tradeoffs of your own husbandry routine. See where it settles into a steady state, then decide whether that’s something you’re OK with. And know exactly which lever in your day-to-day care protocol requires adjustment if not.