Parameter After Top Off Calculator
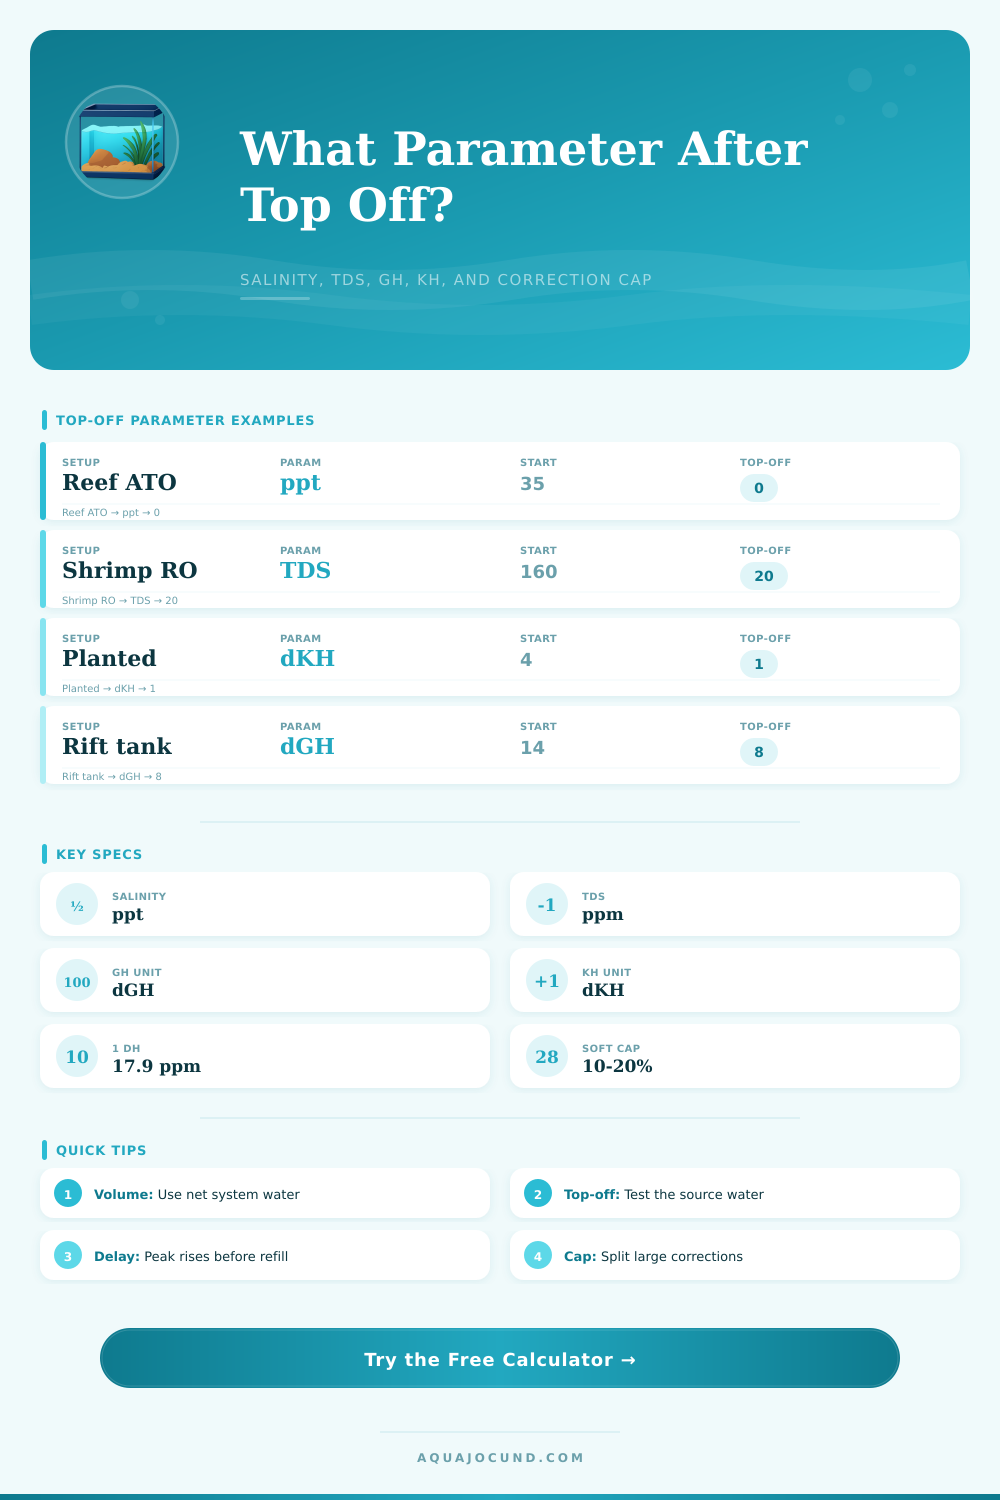
Estimate salinity, TDS, GH, or KH after evaporation and top-off, then compare the correction volume against a safety cap.
🧪System, Parameter, Evaporation, And Correction Inputs
💧Top-Off Source Quick Grid
📊Top-Off Scenario Comparison Grid
| Scenario | Top-off source | After top-off | Change from start | Correction read |
|---|---|---|---|---|
| Run the calculator to compare RO/DI, matched, low-mineral, and high-mineral top-off sources. | ||||
⚖Parameter Math Reference
| Parameter | Common unit | Evaporation effect | Top-off effect |
|---|---|---|---|
| Salinity | ppt | Rises before freshwater is added | RO/DI lowers the concentrated water back toward the original value |
| TDS | ppm | Dissolved solids concentrate as water leaves | Low-TDS water pulls the final reading down after mixing |
| GH | dGH | Calcium and magnesium hardness concentrates | RO/DI lowers, remineralized top-off can hold or raise it |
| KH | dKH | Carbonate hardness concentrates during evaporation | Buffer-rich top-off can raise alkalinity over time |
🎯Typical Target Bands
| Setup | Salinity | TDS | GH / KH |
|---|---|---|---|
| Mixed reef | 34-35 ppt | High marine range | KH 7-11 dKH |
| Brackish aquarium | 5-18 ppt | Varies by salinity | Often moderate to hard |
| Caridina shrimp | 0 ppt | 90-160 ppm | GH 4-6, KH 0-1 |
| Neocaridina shrimp | 0 ppt | 180-260 ppm | GH 6-8, KH 2-5 |
| Planted community | 0 ppt | 120-300 ppm | GH 4-10, KH 2-8 |
| Rift lake cichlid | 0 ppt | 250-550 ppm | GH 12-18, KH 10-16 |
📏Common System And Top-Off Examples
| System | Net volume | Daily evaporation | Common top-off source | Planning note |
|---|---|---|---|---|
| 10 gal nano reef | 8-10 gal / 30-38 L | 0.15-0.35 gal/day | 0 ppt RO/DI | Small evaporation creates fast swings |
| 40 breeder planted | 34-40 gal / 129-151 L | 0.25-0.75 gal/day | Soft tap or RO blend | Watch KH if top-off water is buffered |
| 75 gal mixed reef | 70-95 gal / 265-360 L | 0.7-1.5 gal/day | 0 ppt RO/DI | Sump and fan use drive daily volume |
| 120 gal SPS system | 120-160 gal / 454-606 L | 1.5-3.5 gal/day | 0 ppt RO/DI | Delay matters more than one top-off dose |
| Rift cichlid tank | 70-125 gal / 265-473 L | 0.5-1.3 gal/day | Hard tap or buffered RO | Match KH/GH if long-term drift appears |
📝Correction Cap Reference
| Cap setting | Best use | Single correction volume | Result behavior |
|---|---|---|---|
| 5% | Very sensitive shrimp or SPS | Small and repeatable | May need several stages |
| 10% | Careful reef or softwater fish | Moderate | Good for cautious daily correction |
| 15% | General community planning | Common default | Balances speed and stability |
| 25% | Hardy fish or prepared water | Larger adjustment | Check temperature and parameter match |
| 50%+ | Emergency or non-livestock mixing | Large change | Use only when the system can tolerate it |
Every day, some amount of water will evaporate from surface of your tank. That water contain dissolved minerals which remain in tank after evaporation. As more water evaporate into air, the mineral concentration goes up. Unless you measure it, you don’t know how bad it gets. And if you do, numbers look worse then they feel. Suddenly, you’re concerned that your shrimps requires soft water or that your corals is suffering from stress. In reality, it’s just physics at work on a closed system.
The calculator above do the math for you. All you have to do is input your source water parameter and net water volume. No guesswork required for safety limits or how much to dilute.
Why Your Tank Water Changes
Many keepers think that replacing lost water return things to how they were. Not so much. Adding straight, pure reverse osmosis deionized water to your saltwater tank will drop salinity. That’s because you’re adding fresh water, which lowers it. So you’re not at whatever salinity was there before it started going up due to evaporation. Instead, you’ll be below what it was when it began rising. That means you’re bouncing up and down rather than maintaining a constant value.
The calculator allow you to see how high the water rose before you topped it off and where it settles once it stabilizes again. Sounds trivial? But it can make difference if you have sensitive livestock.
When considering inputs, you really should of check the volume of your system honestly. A common approach is to use the rated capacity of your tank to make the calculation. No! The actual net water volume are significantly lower than the rated capacity of your tank. Consider the displacement of sand, the porosity of your live rock, and where your sump is set at its operating level. If you use the total tank size rather then the true volume of water, the effect of top-off water appear less dramatic. You end up with wider swings in salinity than those models predict. Why? Because there isn’t as much water to buffer the change.
For those of us that maintain fresh water tanks containing species like Caridina and/or Neocaridina shrimp, things changes. Hardness and total dissolved solids (TDS) is now the things to watch rather than salinity. As minerals, they concentrate through evaporation much like salt. To accurately top off a tank using distilled water, you must know how much distilled water to add to achieve your desired TDS range. Here’s where the calculator come into play. It tells you if you should add pure water or mix in some harder source water.
Timing is another consideration. There’s a lag time between the moment evaporation occurs and the top-off kicks on. This means there will be a short period of higher parameters. That’s often enough to cause sensitive coral polyps to pull back even though the overall average may appear just fine. Taking this lag into account, you’re able to better understand what’s going on inside your system. If your automatic top-off is kicking on too late, you’ll know. If your sump reservoir isn’t large enough to help buffer the sudden increase then you’ll know it as well.
Also consider safety caps when you make water changes. Whether you’re changing water up or down, drastic osmotic pressure change will still shock livestock. The chart on the page provides reasonable parameters where one adjustment shouldn’t harm livestock. These limits depend on their sensitivity. Often times it’s safer to make smaller adjustments more frequently rather than big weekly fixes. For example, you may be tempted to add a gallon of RO water to a nano reef to bring down high salinity. This can bleach the tissue of SPS coral or even kill off sensitive zoanthids.
Also at play is testing accuracy. Do you have a refractometer or TDS meter with a large tolerance band? Chasing decimal points isn’t going to do anything for you there. You’ll use that tool as a way to account for differences among equipment. So when you’re tempted to overcorrect on what may be nothing more than measurement noise, it will give you a reality check against the lure of false precision.
Stable parameters are not absolute; they’re more of a pendulum than a target. Each system will have an equilibrium point. Equilibrium depends on both source water quality and evaporation rates. When you understand this, you stop reacting to spikes. Instead, you start preventing them. You begin to view your tank as a changing volume that requires careful balance. Water evaporates, minerals concentrate, and the cycle continues… until you step in with careful accurracy.