Oxygen Saturation Percentage Calculator
Turn a measured dissolved oxygen reading into percent saturation using temperature, salinity, altitude, target saturation, volume, stocking class, and aeration adjustment.
Oxygen saturation snapshot
Results update from measured DO, water conditions, target saturation, stocking, and aeration.
| Profile | Typical salinity | Target saturation | Planning note |
|---|---|---|---|
| Freshwater community | 0 ppt | 85-95% | Good filter ripple usually keeps a stable reserve. |
| Planted freshwater | 0 ppt | 88-100% | Check early morning when plants have respired overnight. |
| Blackwater / softwater | 0 ppt | 80-92% | Warm, calm water can run lower; verify with livestock needs. |
| Goldfish or koi | 0-3 ppt | 90-100% | High biomass and warm weather need extra exchange. |
| Low brackish | 5 ppt | 85-95% | Salt starts reducing the oxygen ceiling. |
| High brackish | 15 ppt | 85-95% | Warm brackish tanks have less reserve than freshwater. |
| Marine fish-only | 32 ppt | 88-98% | Keep surface film and lids from limiting gas exchange. |
| Reef aquarium | 35 ppt | 90-100% | Skimmers and overflows usually improve exchange. |
| Temperature | Fresh 0 ppt | Brackish 15 ppt | Marine 35 ppt | Use note |
|---|---|---|---|---|
| 59°F / 15°C | 10.1 mg/L | 9.3 mg/L | 8.2 mg/L | Cool water has strong capacity. |
| 68°F / 20°C | 9.1 mg/L | 8.4 mg/L | 7.4 mg/L | Common room-temperature benchmark. |
| 77°F / 25°C | 8.3 mg/L | 7.6 mg/L | 6.7 mg/L | Typical tropical aquarium range. |
| 82°F / 28°C | 7.8 mg/L | 7.2 mg/L | 6.3 mg/L | Warm tanks have a smaller ceiling. |
| 86°F / 30°C | 7.5 mg/L | 6.9 mg/L | 6.1 mg/L | Watch dense or heavily fed systems. |
| Altitude | Pressure factor | Fresh 77°F saturation | Marine 77°F saturation | Planning note |
|---|---|---|---|---|
| Sea level | 100% | 8.3 mg/L | 6.7 mg/L | Full air pressure reference. |
| 2,500 ft / 762 m | 91% | 7.6 mg/L | 6.1 mg/L | Reserve is noticeably smaller. |
| 5,000 ft / 1,524 m | 83% | 6.9 mg/L | 5.6 mg/L | Aeration and stocking margin matter more. |
| 7,500 ft / 2,286 m | 76% | 6.3 mg/L | 5.1 mg/L | Warm marine tanks need caution. |
| 10,000 ft / 3,048 m | 69% | 5.7 mg/L | 4.6 mg/L | Use conservative targets and real measurements. |
| System | Dimensions | Volume | O2 mass at 7 mg/L | Typical use |
|---|---|---|---|---|
| 10 gal nano | 20 x 10 x 12 in / 51 x 25 x 30 cm | 10 gal / 38 L | 0.27 g | Small fish or shrimp. |
| 20 long | 30 x 12 x 12 in / 76 x 30 x 30 cm | 20 gal / 76 L | 0.53 g | Community freshwater. |
| 40 breeder | 36 x 18 x 16 in / 91 x 46 x 41 cm | 40 gal / 151 L | 1.06 g | Goldfish, reef, or growout. |
| 75 gal | 48 x 18 x 21 in / 122 x 46 x 53 cm | 75 gal / 284 L | 1.99 g | Large freshwater or reef display. |
| 300 gal pond | Variable basin | 300 gal / 1,136 L | 7.95 g | Outdoor seasonal oxygen planning. |
| Adjustment | Low setting | High setting | Calculator effect |
|---|---|---|---|
| Stocking class | Light nano stock | Dense growout or koi | Raises the recommended saturation cushion. |
| Aeration adjustment | Still covered surface | Skimmer, overflow, waterfall | Changes expected exchange support and status note. |
| Night demand | Clean sparse tank | Heavy plants, algae, feeding | Subtracts a practical overnight reserve allowance. |
| Meter correction | Negative offset | Positive offset | Applies to measured DO before saturation percent is computed. |
Take that dissolved oxygen reading you read about in a tank… 7.2 milligrams per liter. Sounds good on paper, doesn’t it? Feels like its safe. But rarely is it ever “safe” in terms of water chemistry based off a number (it’s all contextual). What will keep a goldfish alive may kill a discus. A reading in warm saltwater isn’t equal to one in cold fresh.
It’s for this reason you aren’t concerned only with concentration (i.e., mg/L) but rather its corresponding percent saturation. The latter tell you the degree to which it is filling up whatever capacity exists at any point in time. The amount of dissolved oxygen any volume of water can hold varies all the time. Cold water holds more; warm water less. Salted water reduces it some more. So a tank of standard marine salinity water running at 82 degrees can’t hold nearly as much as freshwater in a cool (e.g., 70 degree) planted tank.
Why Percent Saturation Matters More Than Numbers
The oxygen calculator take both variables into account, salinity and temperature. It’ll take the value you entered and calculate how close you are to the ceiling on a percentage basis. This matters because your livestocks stress levels are determined by how close you are to that maximum capacity, not just by the number of milligrams present. An 80% saturated value in an 82 degree saltwater tank means your fish are in trouble. It may look good compared to another system, but that fish is still gasping.
Many hobbyists don’t consider altitude, which is yet one more wrinkle. As altitude rises air pressure decreases, making it harder for dissolved oxygen to reach the water’s surface. This means your oxygen ceiling in your tank is less than at sea level if you’re in Santa Fe or Denver. The tool uses local elevation data to take this into account. And it keeps you away from assuming that you’ve got a full tank of air based on generic charts that presume full atmosphere pressure. You may believe you’re at 85 percent, healthy! You might actualy be closer to 90 percent of a much smaller total. That little difference is all it takes.
You can also set parameters for the amount of surface agitation and stocking density in the tank. Those values will affect the safety limits built into the outcome. For instance, a goldfish bowl with lots of fish require more reserve than a lightly stocked shrimp tank. Similarly, a closed system with still covered lid doesn’t have the same natural gas exchange as one with a waterfall overflow. That’s why the reference table on the page lists typical benchmarks for those profiles. It helps you see if your setup falls into a low-risk zone or a watch zone.
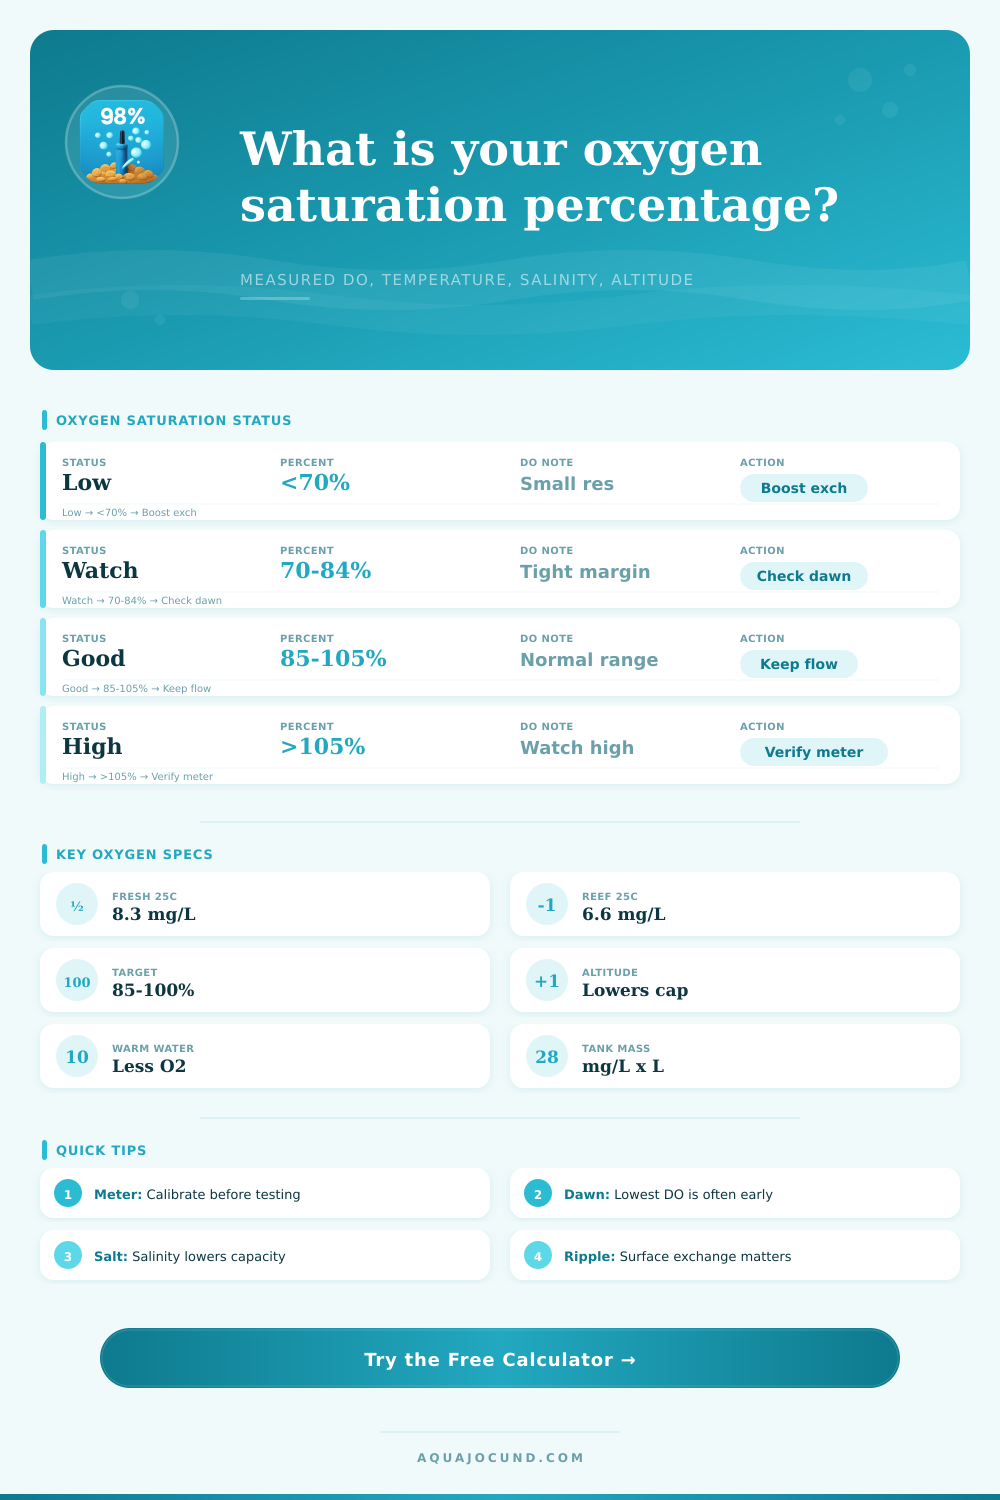
Below 70 percent oxygen saturation is a red flag; this level indicate respiratory stress. Saturation gets too high above 105 percent. This signals supersaturation and can lead to gas bubble disease if unchecked.
But then there’s nighttime. Oxygen-producing plants also use up oxygen during the night (respiration). Without photosynthesis, dissolved oxygen levels drops overnight, which is usually when they are at their lowest. Testing levels while your lights are on will leave you with a false sense of security… you’ll never know about the night-time dip. The tool has an input for night time demand allowance so that you can account for the oxygen drop-off at night. This allows you to figure out whether or not you’re aerating enough to sustain your livestock throughout the night.
The last variable is calibration. Meters do move out of whack with time. With a little calibration tweaking in the settings menu, you can offset any small calibration error without having to start all over testing again. Enter a negative number if it’s off by reading high. It will just mean the percentage it calculates is based on what’s real instead of skewed by the meter itself. When choosing things like increasing your flow rate or adding an air stone, you want data that’s not biased.
Managing oxygen isn’t necessarily about hitting a number or chasing perfection, but rather managing what it means. You know that your water has a certain amount of air that it can hold in any given condition, and you work within those parameters. You must recognize that salt and heat reduces that capacity. Stop fighting physics and embrace it.
Stability. You want enough of a buffer so that daily variations won’t drive your livestock into the danger zone. And that buffer shows up in the % saturation. Watch the dawn lows, believe the adjusted values, and look at the air as well as the water.
You should of checked for a more luxurius setting before starting.