Nitrogen Dosing Calculator Planted Tank
Calculate planted tank nitrogen doses from tank volume, current nitrate, target NO3 or NO3-N, uptake, dosing interval, and KNO3, urea, or liquid nitrate source strength.
🌿Planted Tank Nitrogen Presets
🧪Tank Volume and Nitrogen Target
Nitrogen Dose Estimate
⚙Nitrogen Source Comparison Grid
📊NO3 and NO3-N Conversion Table
| Nitrate as NO3 | As NO3-N | N mass in 100 L | Pure KNO3 needed |
|---|---|---|---|
| 5 ppm NO3 | 1.13 ppm N | 113 mg N | 0.82 g KNO3 |
| 10 ppm NO3 | 2.26 ppm N | 226 mg N | 1.63 g KNO3 |
| 15 ppm NO3 | 3.39 ppm N | 339 mg N | 2.45 g KNO3 |
| 20 ppm NO3 | 4.52 ppm N | 452 mg N | 3.26 g KNO3 |
🔬Nitrogen Source Factors
| Source | N fraction | NO3 equivalent | Extra ion note |
|---|---|---|---|
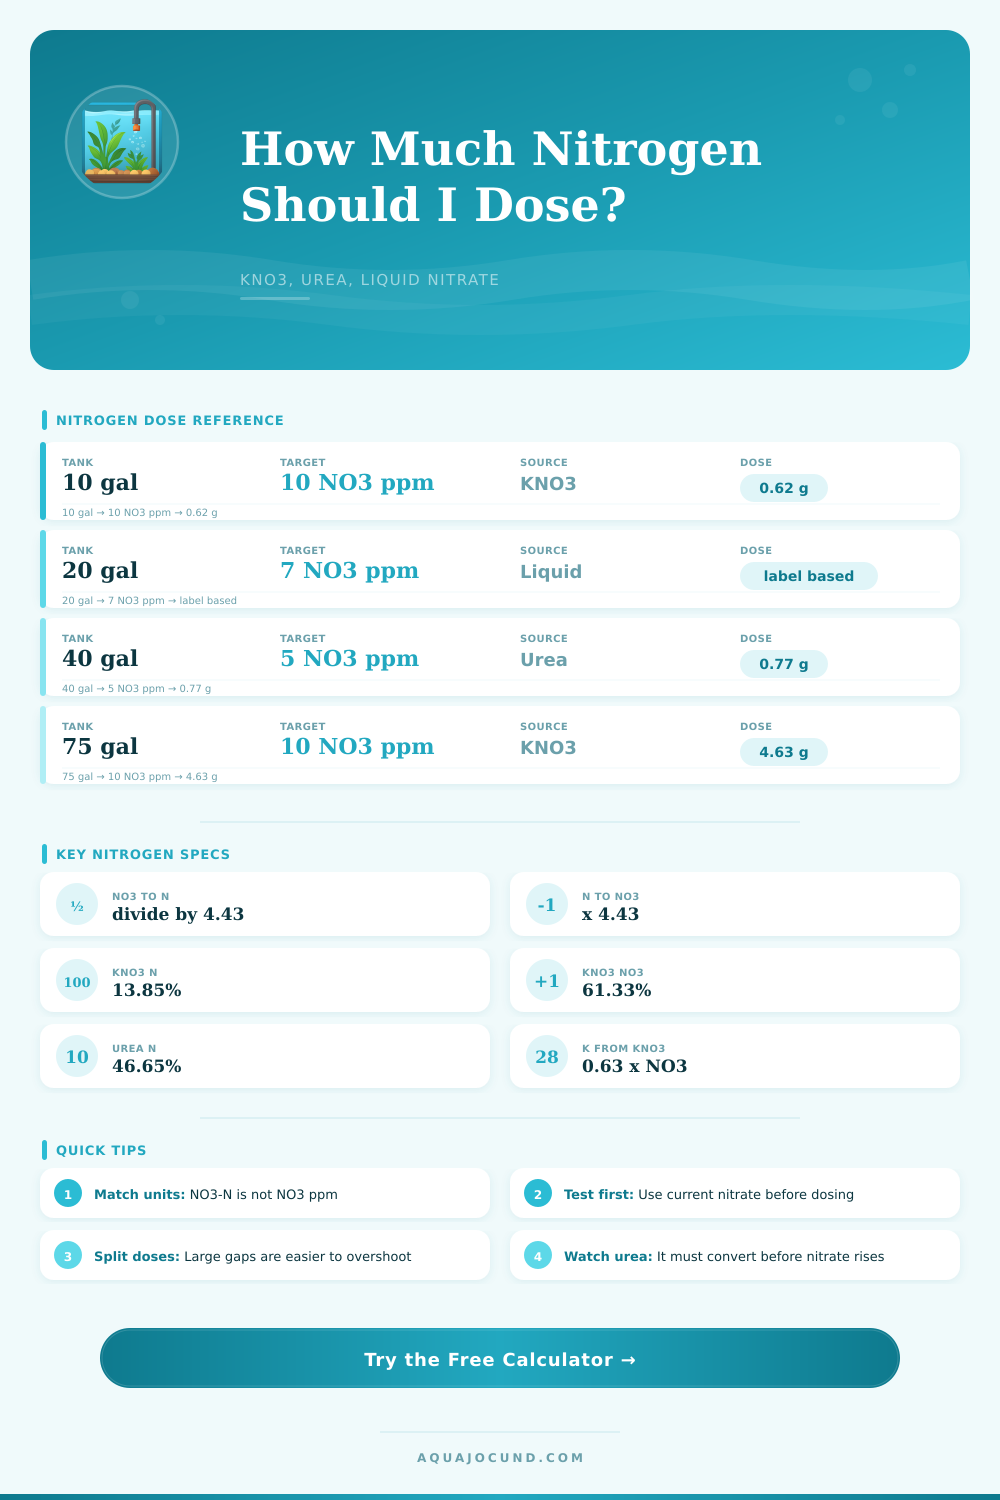
| Potassium nitrate KNO3 | 13.85% | 61.33% actual NO3 | Adds about 0.63 ppm K per 1 ppm NO3 |
| Urea CO(NH2)2 | 46.65% | Calculated as NO3-N equivalent | No potassium; nitrate appears after conversion |
| Liquid nitrate as NO3 | Label dependent | Use label NO3 basis directly | Best when label says nitrate ppm |
| Liquid nitrate as NO3-N | Label dependent | Multiply by 4.43 for NO3 equivalent | Common on lab or fertilizer labels |
| Calcium nitrate tetrahydrate | 11.86% | 52.53% actual NO3 | Adds calcium along with nitrate |
📏Common Tank Starting Nitrogen Doses
| Tank size | Dimensions | Volume | Pure KNO3 for +10 NO3 ppm |
|---|---|---|---|
| 10 gallon | 20 x 10 x 12 in / 51 x 25 x 30 cm | 38 L | 0.62 g |
| 20 long | 30 x 12 x 12 in / 76 x 30 x 30 cm | 76 L | 1.24 g |
| 40 breeder | 36 x 18 x 16 in / 91 x 46 x 41 cm | 151 L | 2.46 g |
| 55 gallon | 48 x 13 x 21 in / 122 x 33 x 53 cm | 208 L | 3.39 g |
| 75 gallon | 48 x 18 x 21 in / 122 x 46 x 53 cm | 284 L | 4.63 g |
| 125 gallon | 72 x 18 x 21 in / 183 x 46 x 53 cm | 473 L | 7.71 g |
📅Schedule Planning Guide
| Plant demand | Typical uptake | Interval fit | Planning note |
|---|---|---|---|
| Low light rhizomes | 0.2-0.7 NO3 ppm/day | 2-7 days | Small additions reduce test noise |
| Mixed community plants | 0.8-1.8 NO3 ppm/day | 2-4 days | Useful middle ground for lean dosing |
| High light stems | 2-4 NO3 ppm/day | 1-3 days | Needs repeated testing after trims |
| Dense Dutch growth | 3-6 NO3 ppm/day | 1-2 days | Frequent doses hold steadier nitrate |
One of the stems on a stem plant have some whitish discoloration just below leaf. It’s not an infection, typically. But it’s also not algae. Rather, it indicates that plants is out of balance: specifically, they’ve depleted their own nitrogen stores. Because nitrogen fuels photosynthesis, a lack of it stress the plants. Keeping it balanced prevents nuisance blooms. Balancing your nitrates keep your plants happy and free of these nuisances.
Enter your tank size and desired ranges into calculator above, and it will do math for you. No more stoichiometry guessing! Now you just has to know what all those numbers equate to in water column. Elemental Nitrogen is NOT what most hobbyist think of as nitrate. When we buy aquarium test kits, they typicaly test for the nitrate ion itself. If you look at fertilizer, it will state its nitrogen content by weight. However, because molecule has oxygen in it, that adds mass and the two values does not equal one another. For example, pure potassium nitrate are about 13.85 percent nitrogen by weight. That means you have to use almost seven times more salt to achieve same result. It is obvious when you look at conversion column compared to required raw mass on the table below. Don’t mix these together. There’s a huge potential dosing mistake that will either starve your plants completely or shock your livestock.
How to Feed Your Plants Correctly
Liquid concentrate vs. Dry salts: This affects how you work more than what you work with. The pros of dry potassium nitrate is stability (it’s dry) and economy. If you have a digital gram-scale, you can achieve exact dosing. Mix an exact amount in some water and drop it in tank. Liquid forms are convenient. Pre-measured doses in milliliters or drops per gallon take away a bit of accuracy. They may also include additives such as trace metals. Unlike straight salts, these can builds up. Read labels carefuly. Urea is somewhere in the middle. It has lots of N, but it doesn’t become plant-available until it is bio-converted. It’s more about keeping it stable in-between doses than initial dose itself.
Nitrogen is being consumed 24/7 by plants while light are present. That means levels decreases over time…until following dose. Dosing weekly? Your water chemistry is all over the place. Wild swings between extreme highs and lows is stressful for plants that need a constant supply of nitrogen. Spreading that dose over several days tame the ups-and-downs. It provides steadier growth and minimizes algae issues because algae love nutrient spikes. The calculator support this. You can specify an interval and it calculates how much nitrogen your bioload will eat up in that timeframe.
Finally, the proof is in the pudding as they say; testing will always serve as your final confirmation. Theoretically, you’re right on track but that’s with ideal conditions. Maybe your substrate actualy buffers nitrate? Perhaps your lighting isn’t giving enough light and limiting plant growth? In reality, your tests may indicate that your nitrate levels has risen significantly higher than what you intended after dosing. Well then, you’re clearly over feeding. On the other hand, maybe they’ve dropped all the way down to zero without another dose being ready. Then it’s time to feed more or feed sooner. Feed less then the calculation shows initially and work up from there until you notice consistent uptake values on your test results. This takes into consideration what’s really happening in your tank vs what the formula should of happened.
You’re not locked into an inflexible system anymore. You’re adjusting according to real world results to create a healthier tank. To dose successfully, it’s both an art and science; half math, half observation. While tables and tools are a great place to start, ultimately, it is your eyes that tells the rest of the story. If new leaves emerge in good shape with rich coloration, then the balance has been achieved. The clear stem from day one dissapears, making room for thick, healthy leaves that signal success.
The system is functioning. It requires less attention (less fuss over ppm) and more appreciation (more appreciation of the living landscape you’ve established).