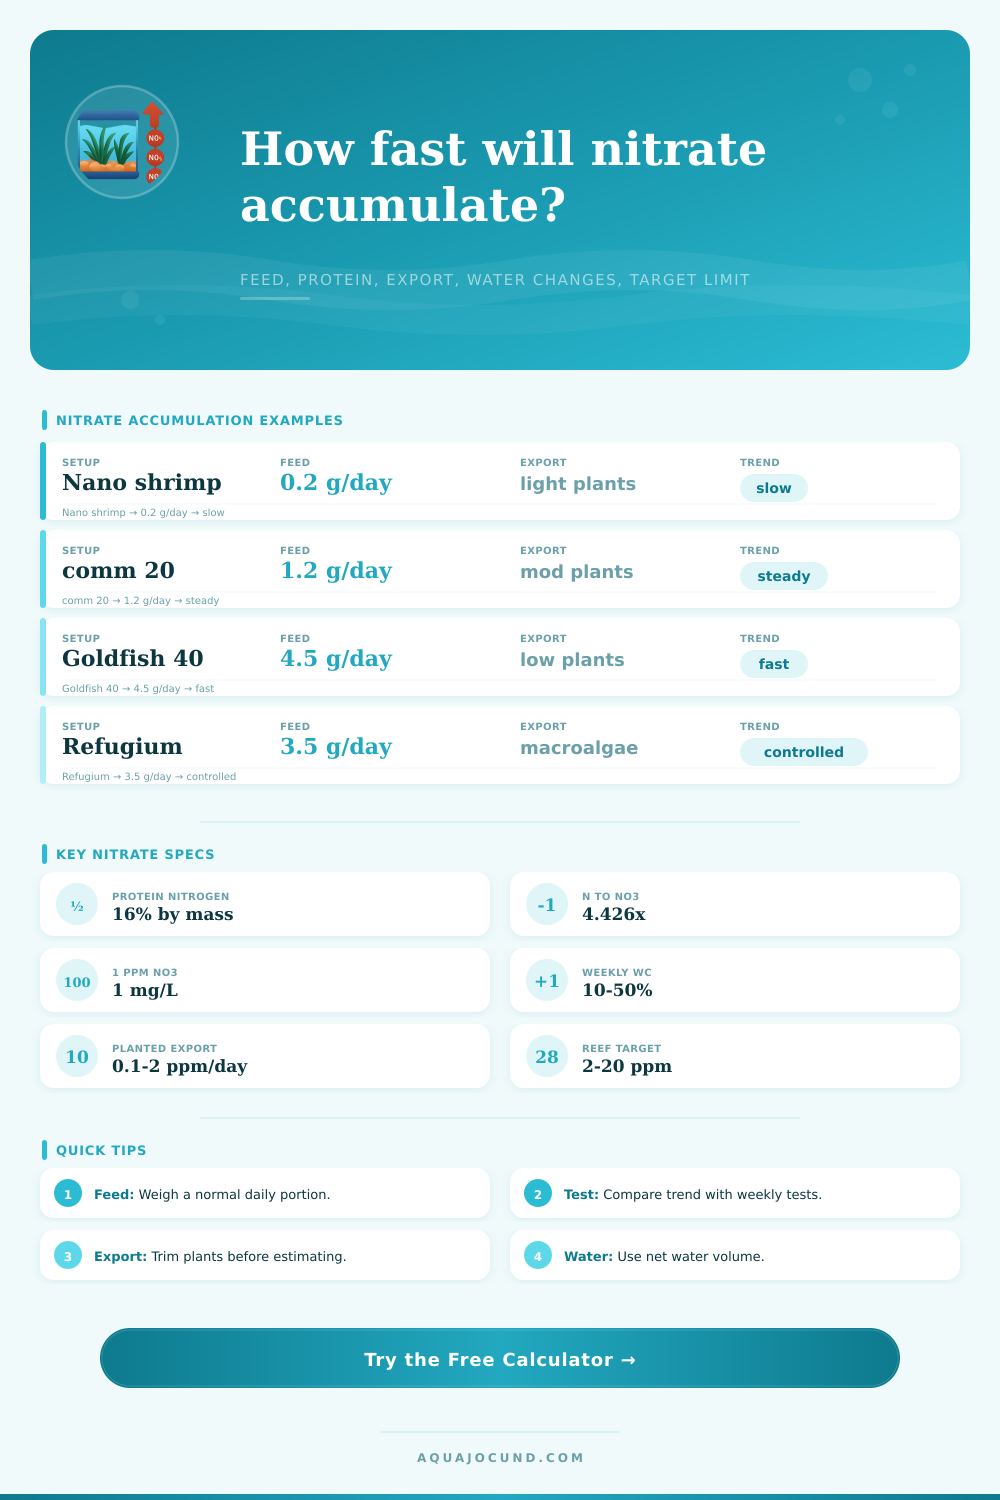
Nitrate Accumulation Rate Calculator
Estimate daily nitrate rise from feed grams, protein, tank volume, nitrogen-to-nitrate conversion, plant or refugium export, water changes, current nitrate, and target limit.
Nitrate trend snapshot
Results update from feed input, protein, nitrate conversion, export, water volume, and water-change schedule.
| Feed profile | Typical protein | Conversion guide | Nitrate planning note |
|---|---|---|---|
| Community flake or granule | 38-46% | 60-75% | Balanced everyday food, moderate nitrate source. |
| High protein pellet | 45-55% | 65-80% | More nitrogen per gram; useful for cichlids and predators. |
| Frozen food blend | 8-18% | 45-65% | Wet weight includes water, so grams do not equal dry pellets. |
| Prepared gel food | 12-22% | 50-70% | Often lower protein by wet weight but fed in larger portions. |
| Algae wafer / veggie feed | 25-35% | 55-70% | Useful for herbivores; uneaten pieces can raise waste. |
| Reef frozen and coral food | 10-25% | 50-75% | Export depends heavily on skimming, refugium, and coral uptake. |
| Input or export | Typical range | Calculator entry | Effect on result |
|---|---|---|---|
| Fish food protein nitrogen | 0.03-0.35 g N/day | Feed grams and protein % | Main nitrate source in most aquariums. |
| Uneaten food and decay | 0-1 ppm/day | Other nitrate source | Adds a direct daily ppm source. |
| Fast plant uptake | 0.1-2 ppm/day | Export as ppm/day | Subtracts nitrate before schedule projection. |
| Refugium macroalgae | 0.05-1.5 ppm/day | Export as ppm/day or mg/day | Can offset part of a reef feeding load. |
| Water changes | 10-50% per interval | Percent and interval | Removes a matching nitrate fraction at each change. |
| Tank example | Dimensions | Volume | 1 g of 40% feed at 70% | Typical planning use |
|---|---|---|---|---|
| 10 gal nano | 20 x 10 x 12 in / 51 x 25 x 30 cm | 10 gal / 38 L | 5.0 ppm NO3 | Small planted or shrimp systems. |
| 20 long | 30 x 12 x 12 in / 76 x 30 x 30 cm | 20 gal / 76 L | 2.5 ppm NO3 | Community feeding trend checks. |
| 40 breeder | 36 x 18 x 16 in / 91 x 46 x 41 cm | 40 gal / 151 L | 1.3 ppm NO3 | Goldfish, growout, or reef planning. |
| 75 gal display | 48 x 18 x 21 in / 122 x 46 x 53 cm | 75 gal / 284 L | 0.7 ppm NO3 | Large planted or reef display. |
| 120 gal system | 48 x 24 x 24 in / 122 x 61 x 61 cm | 120 gal / 454 L | 0.4 ppm NO3 | High-volume refugium and sump systems. |
| Schedule | Average removal | Best fit | Calculator note |
|---|---|---|---|
| 10% weekly | Small reset | Lightly stocked planted tanks | Trend relies mostly on low feeding or strong export. |
| 25% weekly | Moderate reset | Typical community aquariums | A common planning baseline for nitrate control. |
| 40% weekly | Strong reset | Goldfish, cichlids, heavy feeding | Keeps peaks lower but still follows feed input. |
| 20% twice weekly | Smoother peaks | Growout and sensitive systems | Lower interval days reduces the pre-change peak. |
| Large monthly change | Large swing | Low-load systems only | Long intervals can exceed targets before the change. |
Want proof? Without touching a single fish, you can make a clear tank go cloudy. On Monday, it look great. On Thursday, your test kit shows a gradual increase in nitrates, indicating trouble is coming. But this gradual drift isn’t typically due to lack of attention. Typically it’s math. Learning about nitrate accumulation help change aquarium keeping from a guessing game into a manageable science. Instead of reacting to spikes, you begin to prevent them.
So what’s the issue? Where does all that uneaten food and waste go? Protein isn’t the only thing fish consume. They also breaks it down. Whatever waste and excreta they produce, along with whatever other matter decomposes in the tank, contribute nitrogen to the water column. That nitrogen gets converted by bacteria into ammonia (which is why pH drops when a new tank is set up), then into nitrite (also toxic to fish, though less so). Nitrates accumulate steadily unless something remove them from the water. Because the calculator above accounts for the involved stoichiometry for you, I’ll provide a rough conversion factor of 4.426, which converts a given amount of nitrogen into an equivalent amount of nitrate ions. There’s no need to remember this coefficient. Simply understand that one gram of a high-protein pellet contains more nitrogen than one gram of an algae wafer. In other words: not all feed is created equal.
How to Manage Nitrates in Your Aquarium
Water changes are like a reset button, not a prevention method. Water changes act as a reset button to dilute pollution. One type of pollution can lead to more pollution. Dilution is the solution to pollution. So most of us spends a lot of time and effort doing water changes. But water changes are more of a reset button then a prevention method. In fact, they are part of the problem. If you add 10 parts nitrate weekly to your tank and change half that amount during water changes (5), then your baseline rises. You’re just moving it up at a slower pace.
Enter the tool. It combines refugium export, plant uptake, and your feeding schedule. It asks you to estimate how much nitrate your living plants actualy consume. Often times, we overestimate here. Why? Because we think plants magically clean our tanks. They won’t unless they are actively growing and harvesting. When you use a plant export, it’s a powerful tool. Regularly trimmed, well-lit stem plants in a planted tank can pulls out lots of nitrates every day. Put that value into the calculator as a removal and it will offset the source before calculating your required water changes.
When plants are shaded or otherwise not moving, they don’t takes up much, near zero. Put that number in truthful. Your waste level must match what the real export can handle for your tank, and that’s frequently the difference between a healthy, nano shrimp tank and one that crashes like a goldfish bowl. Because despite having plants, goldfish generate large amounts of wast for their size, so no matter how many plants you have, frequent, big changes is necessary.
Not only does it matter how much you change, but how often as well. If you do a 10% daily water change vs. A 50% weekly water change, the profile of your water chemistry are going to be different. One will maintain steady parameters with a little ripple. The other will have more dramatic swings that can stress sensitive species. There’s also a very clear chart on the page (the reference table) outlining this tradeoff. Essentially, you are working the curve from your last change until the next one. You want to minimize any dramatic spikes that cause fish illness or algae blooms by smoothing them out with smaller changes more frequently.
Another one that is less visible but still ignored by many is tap water quality. Starting out with even modest nitrate levels in your municipal supply due to agriculture runoff puts you ahead of the curve right off the bat by some amount. That’s why there’s a background source field on the calculator. Failure to account for that will result in your model always appearing better then it really is. Accounting for it shows what the accumulation rate actualy is.
Nitrate management boils down to balance. Zero ppm isn’t possible or usually desirable in a planted tank. Instead, it’s about maintaining the level within the safe range for your particular livestock. For reef keepers, the goal is to keep levels low to avoid damaging corals. For planted tank owners, higher concentrations is tolerable because they use fertilizer. The objective is predictability. If you understand how much goes in and out each day, then you are controlling the environment rather than waiting for it to fail. Worry becomes data. That hazy mystery transforms into a clear plan.