Flow GPH to Tank Turnover Calculator
Convert aquarium pump flow into real display turnover after volume, head loss, sump water, bypass flow, display split, powerheads, and target range.
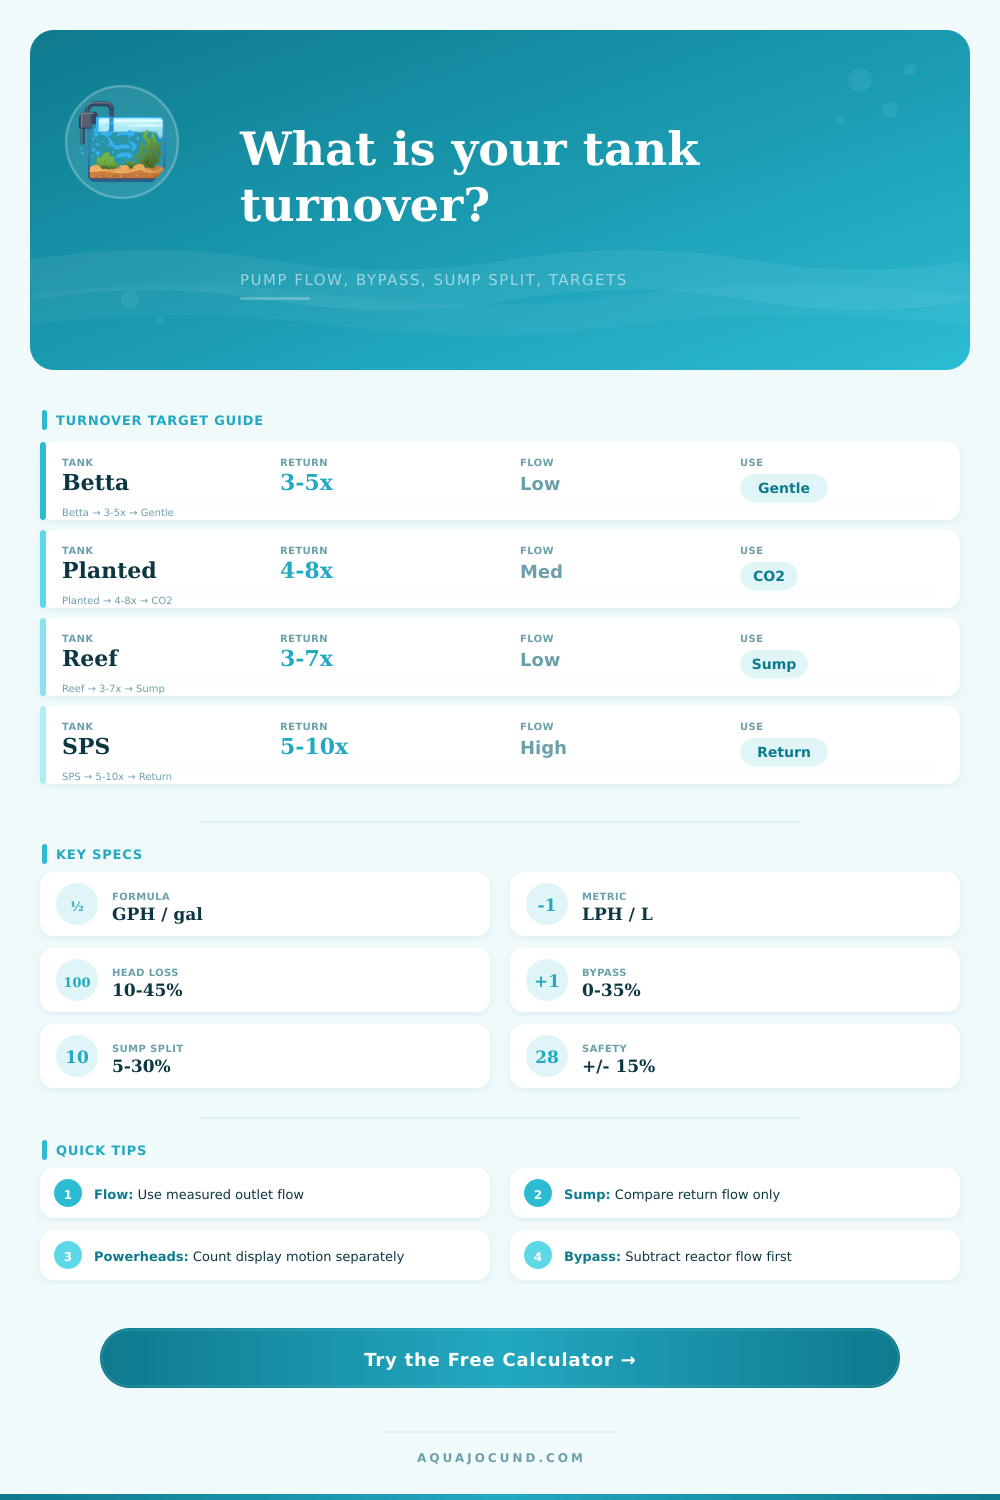
| Tank type | Return turnover | Display circulation | Typical flow note |
|---|---|---|---|
| Betta / long-fin fish | 3-5x display per hour | 3-8x gentle circulation | Diffuse outlets and avoid strong jets. |
| Shrimp or fry tank | 4-6x display per hour | 4-10x with guarded intake | Sponge prefilters reduce real flow. |
| Planted community | 4-8x display per hour | 8-15x broad circulation | CO2 tanks often need even distribution. |
| General community | 5-8x display per hour | 8-15x mixed flow | Use livestock behavior to fine tune outlet direction. |
| Goldfish or messy stock | 8-12x display per hour | 10-18x with surface movement | High waste systems need filter capacity too. |
| Reef return loop | 3-7x display per hour | 15-30x with powerheads | Return flow and in-tank flow are separate jobs. |
| SPS reef return loop | 5-10x display per hour | 30-60x wide turbulent flow | Powerheads should carry most coral circulation. |
| Tank size | Inside dimensions | Net planning volume | 5x return flow | 10x return flow |
|---|---|---|---|---|
| 10 gallon | 20 x 10 x 12 in / 51 x 25 x 30 cm | 8.8 gal / 33 L | 44 gph | 88 gph |
| 20 long | 30 x 12 x 12 in / 76 x 30 x 30 cm | 17.8 gal / 67 L | 89 gph | 178 gph |
| 40 breeder | 36 x 18 x 16 in / 91 x 46 x 41 cm | 35.9 gal / 136 L | 180 gph | 359 gph |
| 55 gallon | 48 x 13 x 21 in / 122 x 33 x 53 cm | 51.0 gal / 193 L | 255 gph | 510 gph |
| 75 gallon | 48 x 18 x 21 in / 122 x 46 x 53 cm | 70.8 gal / 268 L | 354 gph | 708 gph |
| 125 gallon | 72 x 18 x 22 in / 183 x 46 x 56 cm | 110.2 gal / 417 L | 551 gph | 1102 gph |
| Setup condition | Typical loss | What it affects | Calculator input to adjust |
|---|---|---|---|
| Short hang-on filter | 5-15% | Small lift and media drag | Head-loss adjustment |
| Canister with clean media | 15-30% | Hoses, baskets, spray bar | Head loss plus media restriction |
| Under-stand sump return | 20-40% | Vertical lift, elbows, valves | Head loss and display split |
| Reactor or UV manifold | 10-35% | Flow diverted away from display | Bypass percentage |
| Dirty pads or clogged screens | 20-50% | Real delivered flow falls over time | Media and outlet restriction |
| Calculation | Imperial formula | Metric formula | Use for |
|---|---|---|---|
| Display turnover | Delivered gph / display gal | Delivered lph / display L | Filter return comparison |
| Total system turnover | Delivered gph / system gal | Delivered lph / system L | Sump and dosing context |
| Sump pass-through | Delivered gph / sump gal | Delivered lph / sump L | Sump contact time |
| Powerhead circulation | Usable gph / display gal | Usable lph / display L | In-tank movement only |
When you look at the aquarium, you see the flow from return nozzle. You chose a pump rated for high capacity, so it looks like enough. But maybe your corals is pale. Or maybe your betta can barely hold its position near the surface. Many hobbyists gets frustrated when what the manufacturers claim does not match reality.
Why? Because tubing bends resist flow (reducing pressure), gravity opposes vertical lift, and filter media collect waste. The difference is why the turnover rate calculator presented here strips away marketing hype to reveal the actual rates.
How to Calculate Real Water Flow in Your Tank
It starts with asking for real volume shown in tank instead of the nominal size on the glass. Most tanks has lots of rocks, decorations, and/or sand that all take up space and replace water. Take a 75g tank full of rock and other aquascaping materials. That 75g tank may actualy contain about 60g of water. All future flow calculation will be wrong because you used the incorrect amount of water to base the calculation on.
Because the calculator allow you to specify the shape (or add in your own dimension specs), it factors out that displaced water so that all future flow calculations starts from an accurate baseline.
A pump’s ability decrease greatly with head loss. Moving water straight out of an open bucket is easy, that same water must move up against gravity and around corners. It also has to goes through a protein skimmer and down tubing. This will reduce output drasticly. Depending on how complex your plumbing are, you could lose anywhere from twenty percent to fifty percent of original flow.
Because most owners don’t want to admit they have less flow due to their actual plumbing, I included an estimated head loss percentage on the calculator. This shows that what sounds like a great thousand-gallon pump can actually be a six-hundred-gallon pump in real world. Other devices such as calcium reactors or UV sterilizer bypass loops siphon off even more flow and divert water from the main display loop altogether. Overlooking this decrease in flow mean undersizing your system consistantly.
The amount of water circulation will also depend heavily based off which biotype(s) are housed in the tank. For example, betta fish only need enough circulation to overcome their natural tendency to float around in a lazy current where they don’t have to fight against the flow. Three to five times his body volume per hour would of be enough for him.
Conversely, SPS corals prefers large amounts of turbulent and chaotic water circulation to move nutrients into them and clear wastes out of their tissues effectively. Often they need upwards of 50 times, if not more, of overall circulation, most of which come from powerheads, not the main return loop. Check the chart on the page… It illustrates how greatly different biotypes will demand vastly different flows.
Take those ranges with a grain of salt; always tune your system to fit the biologicals’ behavior. It won’t matter what the numbers say if your shrimp hide all the time or your substrate keeps getting moved about. The success of this setup depend on the livestock.
Complicating all of these considerations is the addition of powerheads. These devices provides localized circulation. This may or may not serve to turn over filter media, but it is important for maximizing gas exchange and removing any dead zones. With this tool you have the option to include powerhead as a distinct motion metric.
Why? A tank can appear well-filtered even with low flow as long as the livestock tolerates it, or poorly filtered with high flow if amount of debris moving toward the intake doesn’t match the flow. Still, the gold standard for getting accurate measurements is measuring what comes out by using a stopwatch & bucket. Charts provided by manufacturers tend toward optimism. Plug those measured readings into the inputs and now the numbers reflects what you see.
Now you know if you’ve got enough flow and you no longer guess. Instead, you know where you stand different than your biological requirements. Doing it right makes for better animal welfare and less stress on equipment (the whole point of having an aquarium).