🐟 Fish Growth Length Age Calculator
Estimate expected fish length by age using species growth curves, temperature, feeding, stocking, and water quality modifiers.
Length by Age Estimate
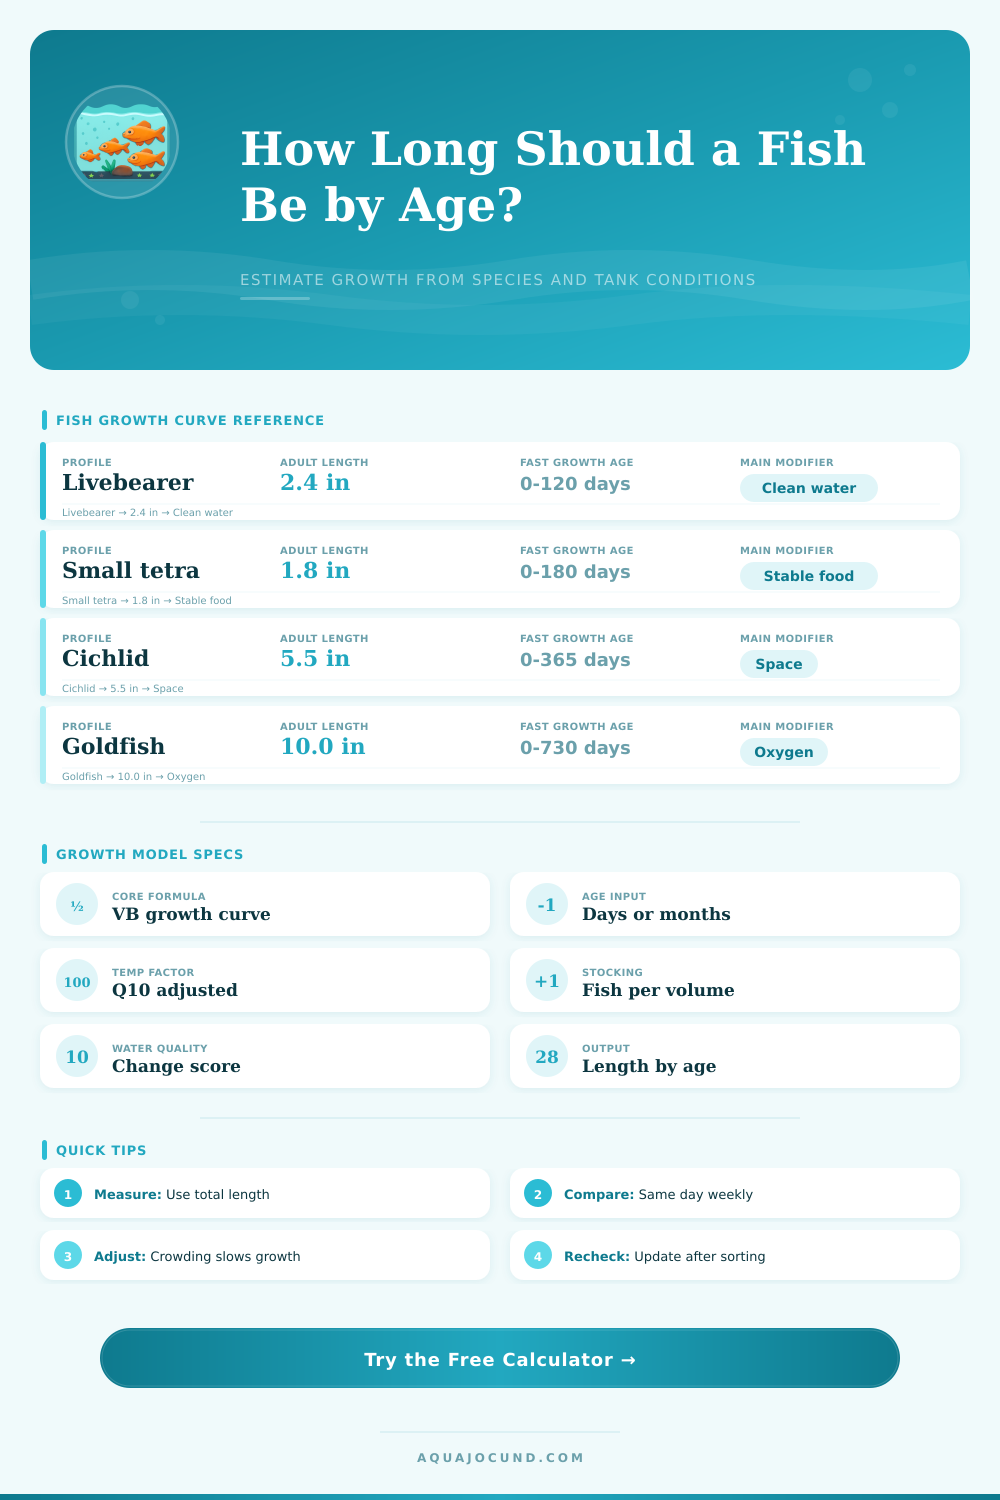
| Profile | Typical adult length | Growth constant | Inflection age | Best use |
|---|---|---|---|---|
| Livebearer / guppy type | 2.4 in (61 mm) | 0.018/day | 20 days | Guppy, platy, molly juveniles |
| Small tetra / rasbora | 1.8 in (46 mm) | 0.012/day | 28 days | Small schooling fish estimates |
| Medium cichlid | 5.5 in (140 mm) | 0.0075/day | 35 days | Angelfish, kribensis, mbuna grow-out |
| Large cichlid | 12 in (305 mm) | 0.0045/day | 55 days | Oscar and similar large juveniles |
| Goldfish / fancy carp | 10 in (254 mm) | 0.0040/day | 50 days | Tank goldfish and fancy varieties |
| Cory / small catfish | 2.5 in (64 mm) | 0.0095/day | 35 days | Corydoras and small bottom fish |
| Betta / gourami type | 2.8 in (71 mm) | 0.0105/day | 32 days | Labyrinth fish juveniles |
| Koi / pond carp | 24 in (610 mm) | 0.0028/day | 70 days | Pond growth planning |
| Rainbowfish | 4.0 in (102 mm) | 0.0065/day | 42 days | Medium schooling juveniles |
| Condition | Typical multiplier | Calculator role | Growth effect | Watch point |
|---|---|---|---|---|
| Below profile range | 0.58-0.88 | Temperature penalty | Slower metabolic growth | Feed less if digestion slows |
| Near optimum | 0.95-1.08 | Stable reference point | Most reliable age estimate | Avoid daily swings |
| Warm but safe | 1.05-1.22 | Temperature boost | Faster length gain | Oxygen demand rises |
| Growth feeding | 1.08-1.18 | Food availability | Better juvenile conversion | Remove uneaten food |
| Rich live rotation | 1.14 | Diet quality | Improved early growth | Keep water changes matched |
| Growth pressure | Stocking cue | Weekly water change | Modifier trend | Result cue |
|---|---|---|---|---|
| Open grow-out | Under target density | 20-35% | Small positive modifier | Length tracks curve well |
| Normal community | Near target density | 25-40% | Neutral to slight penalty | Estimate remains steady |
| Crowded juvenile tank | 1.3-2.0x target | 35-60% | Moderate penalty | Projected length compresses |
| Heavy biomass | Over 2.0x target | 50%+ | Strong penalty | Growth remaining stays high |
| Setup | Dimensions | Volume | Growth use | Typical calculator cue |
|---|---|---|---|---|
| 10 gal tank | 20 x 10 x 12 in (51 x 25 x 30 cm) | 10 gal (37.9 L) | Small fry or juveniles | Good for short projections |
| 20 long | 30 x 12 x 12 in (76 x 30 x 30 cm) | 20 gal (75.7 L) | Schooling juveniles | Lower stocking pressure |
| 40 breeder | 36 x 18 x 16 in (91 x 46 x 41 cm) | 40 gal (151 L) | Cichlid grow-out | Better space for sorting |
| 75 gal tank | 48 x 18 x 21 in (122 x 46 x 53 cm) | 75 gal (284 L) | Large juveniles | Useful for 60-180 day plans |
| 300 gal pond | Variable footprint | 300 gal (1136 L) | Koi and goldfish growth | Volume helps long curves |
There’s no visible way for you to tell the difference between the gravel and the little red dashes that are neon tetras in a bag. They look like specks in transparent packaging. You get ’em home. A month later, they’ve doubled in size. A few more weeks and they moves around with purpose. Another year on, and they seem stuck at the same length they hit six months ago.
What gives? It turns out most fish grow in fits and starts; rapid bursts interrupted by lengthy periods of stagnation. Knowing this helps determine feeding frequency, tank upgrades, and whether crowded conditions will stunt growth over a long period or a short period.
How Fish Grow in Your Tank
Combine environmental factors. The calculator above combines each species’ growth curves, adjusted for the environment. Because each species has its own growth rate, a guppy doesn’t grow at the same pace as an oscar, it begins with their biological base. Then it modifies that according to water temperature, which is the metabolic control for cold blooded creatures. Raising the temp up to a certain point makes them go faster because metabolism speeds up, digestion are improved, and they gain length faster. Going beyond that point raises stress levels and lowers the O2 level. This stalls growth altogether even though it’s warm.
The other key factor here is feeding levels/intensity. While many hobbyists tend to underfeed their fish out of concern that uneaten food will foul water, frequent feeding is important (especially at the juvenile stage). In fact, one of things that the tool considers is feeding frequency/protein content. So if you compare the grow-out regime (which feeds intensively) to a maintenance diet (which is less so), the tool reflects how much quicker cichlids could reach breeding size on a higher protein pellet different than flake food, for example. Not only does it consider what is fed, but also how much.
So what’s your plan? The Ideal Model vs. Reality: This is especially true for water quality and stocking density. If you have a clean, lightly-stocked aquarium, your fish will reach close to their genetic potential. Suddenly add another two dozen fish into the same 20 gallons. Instantly the dynamic change. More crowding = more waste. Even with frequent water changes, your filtration will be strained and your water parameters will suffer. Higher stocking ratios causes ammonia spikes and lower oxygen levels. These issues inhibit the release of growth hormones, so the calculator takes this into account.
Your fish may appear okay… They’re still swimming around! But odds are good they’re spending their energy surviving instead of expanding. These trade-offs are laid out nicely on the page through the reference tables that compare how different species react to the same conditions. For example, a small bowl for a goldfish won’t see that little guy get much bigger then maybe 2 inches (not because it can’t grow to be up to 10 inches long). It doesn’t grow… The environment hampers its growth.
That’s why biomass versus volume is so important and the tool helps you visualize what would of happen if you constrain an animal now: Will your tank accommodate its adult size? When things go wrong most folks wait until it’s obvious and then try to fix the problem, whereas monitoring consistently can identify trends that would’ve been issues before they ever were. When you’re getting good water readings but suddenly your fish stop growing for a couple of weeks, look at your diet and see if maybe you need more protein. Or maybe the temp dipped a degree or two out. These little tweaks can make a big difference with time. You don’t want to push them too hard. You just want the environment to let them grow naturaly without stopping their growth artificially.
Ultimately, it’s all about maintaining an ecosystem for life, not just sustaining life. Understanding how space, food, and temperature work together replaces guesswork with knowledge. It moves you from asking “why do my fish seem so small” to being able to see what needs changing. Seeing allows you to turn a stagnant tank into a thriving habitat. It is a place where every inhabitant has the resources and room to be everything it can be.