Dry Fertilizer Stock Solution Calculator
Calculate dry aquarium fertilizer mass, stock bottle concentration, mL dose strength, ppm per dose, secondary nutrient carryover, and weekly dosing schedule.
🧪Stock Solution Presets
📐Tank Volume and Stock Mix
Dry Fertilizer Stock Solution Estimate
⚗Dry Fertilizer Comparison Grid
📊Dry Salt Source Reference
| Dry source | Primary nutrient | Secondary carryover | Typical planted use |
|---|---|---|---|
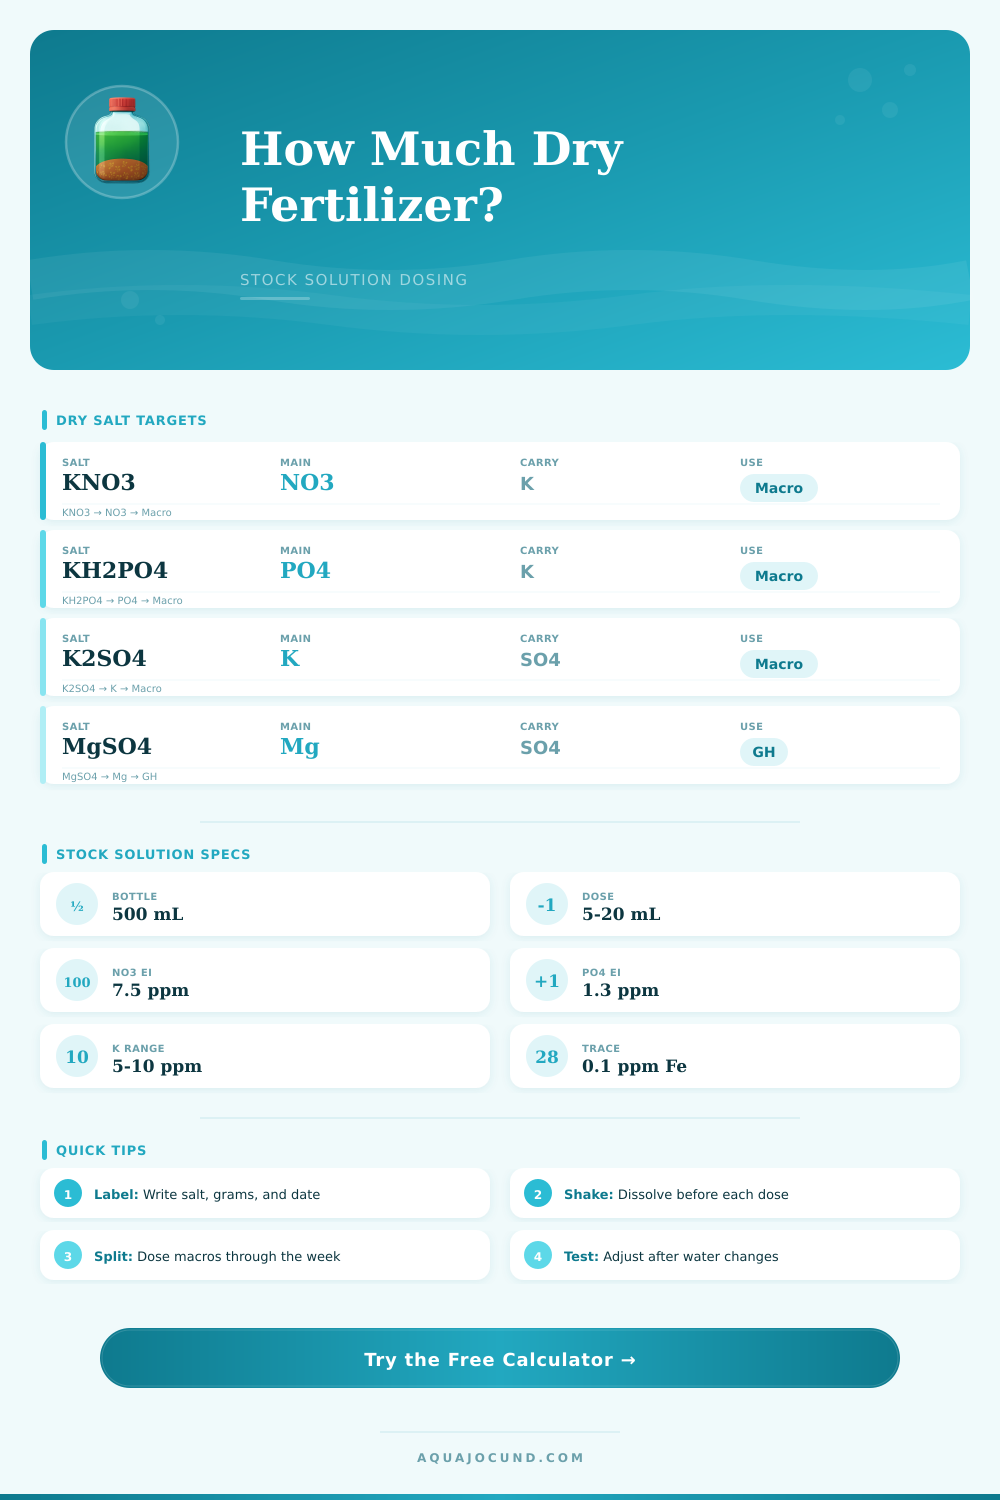
| KNO3 potassium nitrate | NO3 at 61.3% | K at 38.7% | Nitrate macro stock |
| KH2PO4 mono potassium phosphate | PO4 at 69.8% | K at 28.7% | Phosphate macro stock |
| K2SO4 potassium sulfate | K at 44.9% | SO4 only | Potassium without nitrate |
| MgSO4.7H2O magnesium sulfate | Mg at 9.9% | SO4 only | Magnesium and GH support |
| Ca(NO3)2.4H2O calcium nitrate | NO3 at 52.5% | Ca at 16.9% | Nitrate plus calcium |
| Mg(NO3)2.6H2O magnesium nitrate | NO3 at 48.6% | Mg at 9.5% | Nitrate plus magnesium |
| KHCO3 potassium bicarbonate | K at 39.1% | KH alkalinity | Potassium with KH lift |
| CSM+B style trace mix | Fe at 7.0% | Trace blend | Micronutrient stock |
📏Common Stock Bottle Plans
| Tank size | Water volume | Common dose mL | Useful bottle size |
|---|---|---|---|
| 5 gallon nano | 19 L / 5 gal | 1 to 2 mL | 100 to 250 mL |
| 10 gallon shrimp | 38 L / 10 gal | 2 to 5 mL | 250 mL |
| 20 long planted | 76 L / 20 gal | 5 to 10 mL | 500 mL |
| 40 breeder | 151 L / 40 gal | 10 to 15 mL | 500 to 750 mL |
| 75 gallon display | 284 L / 75 gal | 15 to 30 mL | 750 to 1000 mL |
| 125 gallon planted | 473 L / 125 gal | 25 to 50 mL | 1000 to 2000 mL |
🌡Solubility and Mixing Checks
| Source | Approx solubility at 20°C | Stock warning point | Mixing note |
|---|---|---|---|
| KNO3 | About 316 g/L | Stay under 80% | Warm water speeds dissolving |
| KH2PO4 | About 220 g/L | Usually easy | Keep separate from iron trace |
| K2SO4 | About 111 g/L | Can be limiting | Use larger bottle if cloudy |
| MgSO4.7H2O | Very soluble | Usually easy | Often mixed as GH stock |
| Trace mix | Label dependent | Use preservative if needed | Store cool and dark |
📅Schedule Target Guide
| Dosing style | NO3 per dose | PO4 per dose | K per dose |
|---|---|---|---|
| Lean shrimp tank | 1 to 3 ppm | 0.1 to 0.3 ppm | 1 to 3 ppm |
| Low tech weekly | 3 to 6 ppm | 0.3 to 0.8 ppm | 3 to 6 ppm |
| EI style split | 5 to 10 ppm | 1 to 2 ppm | 5 to 10 ppm |
| High light CO2 | 7.5 to 15 ppm | 1.3 to 3 ppm | 7.5 to 15 ppm |
| Trace stock | Not used | Not used | Target Fe instead |
With that said, how do you know what to add? This table can help (after all, it’s hard to remember the conversion factors and solubility limits). Alternatively, just use the calculator at the top of this page… Simply enter the size of your tank(s) and target nutrient concentrations (i.e., “how much do I want X in my tank?”). It will calculate everything else for you. In other words, it translates ambiguous goals into milliliter and gram terms.
Why does that matter? Because too little nutrient inhibit growth; too much create an invitation to algae. The next thing you need to realize: what’s actualy IN that powder? There is a reason we call them ‘fixed’ formulas. For example, potassium nitrate contains both potassium and nitrogen, but only in specific amounts. It doesn’t allow you to add one without adding the other.
How to Use the Dosing Calculator Correctly
This makes it difficult to plan out your whole nutrient regime because you are forced to work within those fixed ratios. That’s what this chart on the page is for. It shows you exactly where the nutrients comes from: mono potassium phosphate adds potassium and more phosphate, while magnesium sulfate just adds hardness (no nitrogen). When most newbies target their phosphate and nitrates separately, they end up wondering why their potassium levels keep crashing/soaring. Keeping each nutrient source separate let you adjust them individually.
Many folks are tripped up by volume measurements since they assume the name of the tank is what it contains. For example, a 20g long tank isn’t nearly as large than a regular 20g cube. The tool compensates for things like glass thickness and gravel displacement by having you enter your specific tank size(s) or choose from a list of profiles. Dosing based off the number printed on the glass side means you’ll likely be overfeeding your plants. Preventing waste and keeping water parameters stable between feedings require precision here.
There’s another variable in play that isn’t so obvious: solubility. Certain salts is easy to dissolve in warm water, but they can be hard to dissolve unless you add a lot or use hot water. Some, like potassium sulfate, are realy picky about dissolving. You could of end up with crystallized chunks on the bottom of your small container because you packed it in too full.
Then what? When you go to dose, you won’t get a consistent amount each time. You shake the bottle then it pours out all grainie. The calculator prevents that by telling you whether your desired concentration is higher than recommended for that particular salt. If the math say you’re close to saturation, it recommends a bigger bottle, or lower stock concentrations. That way, you won’t waste your time trying to melt something that just doesn’t want to cooperate (and make your water cloudy as a result).
Frequency of dosing, It’s night and day. Split dosing provide nutrients during the day as they occur naturaly. This reduces peak concentrations that algae will eat up, instead of dumping everything in one go. When you run your numbers on a single dump/week vs 3 times/week you’ll see how fast the bottles deplete different. Each feeding cause less nutrient shock when you use a small dose per day instead of huge amounts all at once. Instead of plants taking in all their food at once (like a bunch of unmanageable bites), they do better when it’s fed in manageable bite sized doses.
Dose volume adjustment in inputs shows this approach by helping ensure the bottle doesn’t sit stale for months and won’t be gone by mid week. Nutrients aren’t the only chemicals that contribute to water changes. Calcium nitrate cause slight increases in alkalinity. Potassium bicarbonate gently buffers pH down. This adds up week-to-week. Understanding those side-effects and tracking them helps against accidentally tipping water balance.
Fortunately, the tool tracks carryover nutrients too, no need for guessing your way into a chemical imbalanced tank by running after green stems. It’s non negotiable to label each of the bottles with exact salt weight and date. Records never forget, memory does. Being able to troubleshoot if there are problems mean knowing exactly what went into the aquarium.
The sediment will settle quickly so shake the bottle before use. Your best friends is test kits to confirm your calculations match reality for your set of conditions. Treat it like this, set conservative target levels and watch how plants respond. Iron deficiency can cause yellowing leaves, and so can poor uptake of other macros. High phosphate imbalance can lead to brown algae, which is commonly associated with low nitrate. Your eyes will be your feedback loop (the calculator provides the roadmap). Adjust accordingly, note the change, and follow the data toward your next mix.
There’s a reason it works, it eliminates the guesswork from routine maintenance. If you know what you put in, you get clean water.