🧪 Dose Ramp Increase Rate Calculator
Plan a safe aquarium dosing increase from a starting dose to a target dose with percent caps, nutrient or alkalinity sensitivity, and a day-by-day stage schedule.
| Day | Total daily dose | Daily increase | Projected test value | Stage action |
|---|---|---|---|---|
| 1 | Run calculation | Run calculation | Run calculation | Schedule appears here |
| Dose type | Typical daily cap | Response speed | Main caution |
|---|---|---|---|
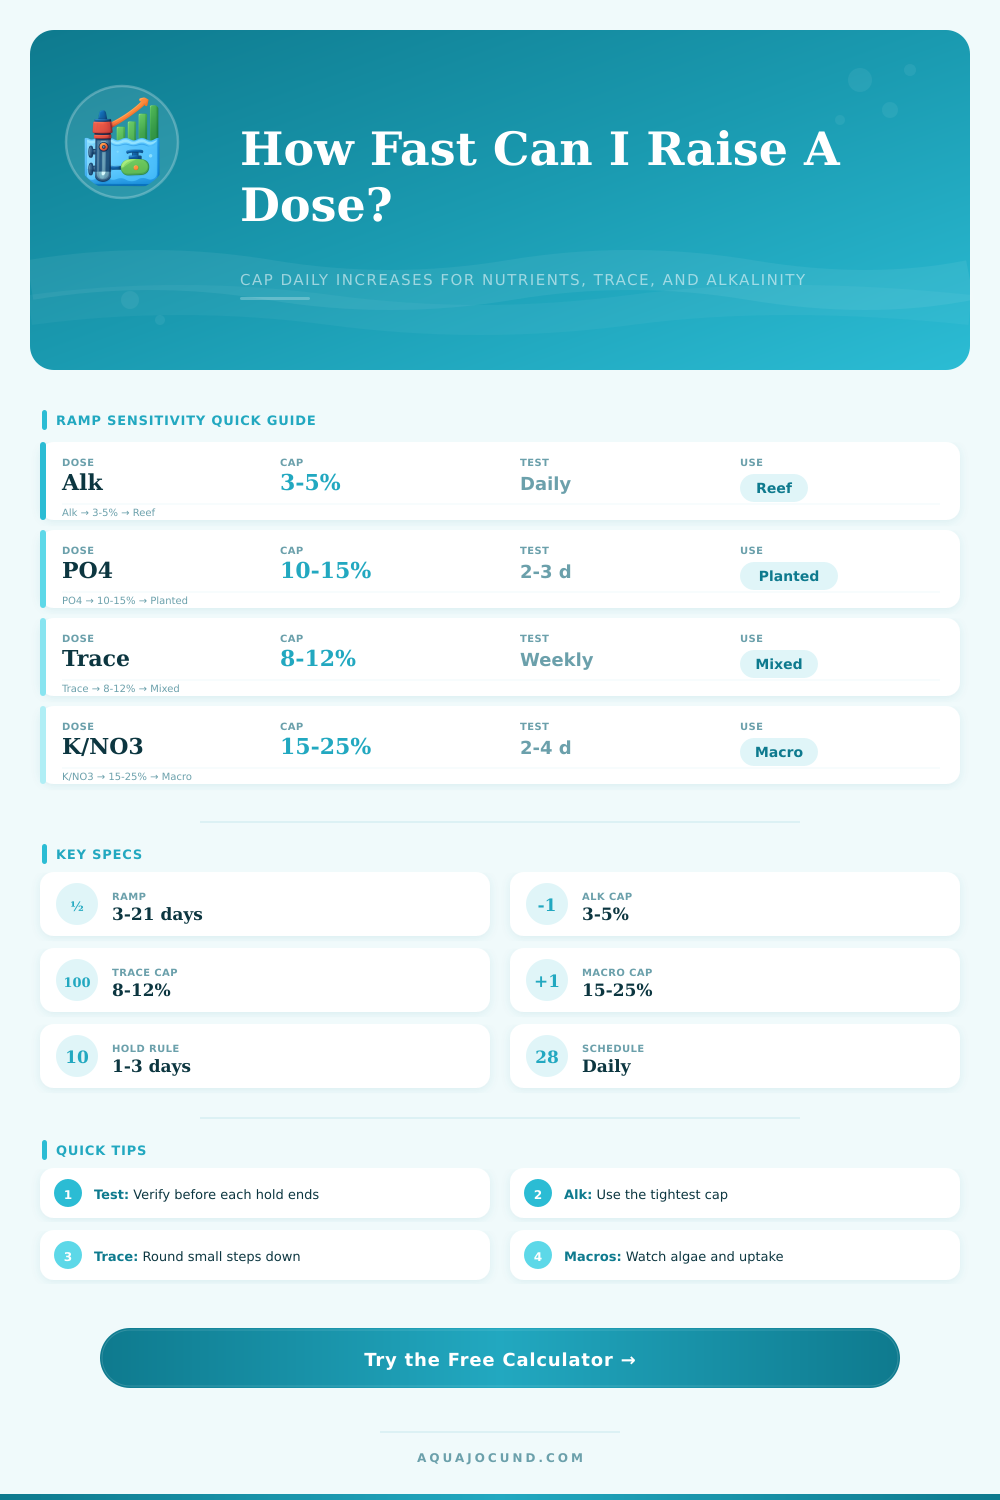
| Alkalinity supplement | 3% to 5% | Same day | Avoid sharp dKH swings in reef tanks |
| Phosphate macro dose | 10% to 15% | 1 to 3 days | Rock and substrate can hide true demand |
| Nitrate macro dose | 15% to 25% | 2 to 4 days | Watch plant uptake and algae response |
| Potassium macro dose | 15% to 25% | Several days | Usually forgiving, but avoid very large jumps |
| Trace or micro dose | 8% to 12% | Weekly trend | Small overages can irritate shrimp or softwater fish |
| Carbon or organic dose | 5% to 10% | 1 to 2 days | Bacteria and oxygen demand can change quickly |
| Profile | Cap used | Best fit | When to slow down |
|---|---|---|---|
| Hardy planted grow-out | Up to 30% | Plant racks, macro tuning, visible uptake | Algae surge, cloudy water, stalled pearling |
| Standard community or mixed reef | Up to 20% | Most routine dose ramps | Livestock behavior changes or test drift |
| Sensitive livestock or new tank | Up to 12% | New aquariums, recovering fish, unknown demand | Any ammonia, nitrite, or stress signal |
| Reef alkalinity cautious | Up to 8% | Mixed reefs and alk pumps | Daily dKH moves faster than expected |
| SPS or high-demand alk | Up to 5% | Acropora systems, automated alk correction | Burnt tips, pale tissue, pH instability |
| Shrimp or softwater cautious | Up to 6% | Caridina, blackwater, micro traces | Molting issues or sudden hiding |
| Signal | Schedule response | Suggested test | Reason |
|---|---|---|---|
| Cap-limited day | Keep the capped step and retest | Parameter being dosed | The desired linear step is faster than the selected safety limit |
| Single event too high | Increase dosing events or lower the target | Pump calibration or measured cap | The daily total may be fine, but one bolus is too large |
| Test value overshoots | Hold or reduce to the previous stage | Fresh kit or second method | The tank is responding faster than the model assumes |
| Livestock stress | Stop ramp and maintain only essentials | Ammonia, pH, oxygen, target parameter | Behavior outranks the schedule in sensitive systems |
There’s a particular type of panicky feeling that results when watching your water parameters shift. You realize that something bad is about to happen, such as coral polyps retracting or an algae bloom starting. You immediately want to reach for a bottle and pour it in! A change might be good, such as lowering ammonia or nitrates, but biology doesn’t like quick changes. Just like a crash, a rapid increase in pH or other nutrient can also shock your system; your livestock has evolved to cope with gradual changes.
This is a dose ramp increase rate calculator. It uses practical rounding, sensitivity profile, percent cap, ramp days, target dose, and starting dose to create a dosing schedule for your aquariums. By entering how much you want to get to each day and how much you’re currently getting, it converts the “gotta do something now” impulse to a mathematically controlled progression of changes. That’s where the constraints does all the heavy lifting.
Why Slow Changes Are Good for Your Tank
You input how fast you can go before you mess up stability of your tank. How aggressive can you be? Well, if you’re dosing some alkalinity on reef tank, maybe three percent cap per day is aggressive enough. Maybe five. With plant nutrients like nitrates (macros), you can usually go as high as fifteen percent provided that you monitor any algae reactions and keep in mind that plants will take only what they need.
It also makes you face your desires versus reality. Your livestock have tolerance levels. The tool pits what you think should of been increased (linearly) against these harder tolerances. For example, if your calculations say to add 10 milliliters per day so that you’ll reach your mark by next week, but its reaction pattern indicate you can only tolerate a 2 percent rise, then the schedule will beat your acceleration in the name of stability.
And this isn’t some chem-nerd business, it’s a matter of biological lag time. What test kits report is current, but the ecosystem responds over days. What seems ideal on paper could result in a bloom tomorrow because bacteria population cannot catch up to the nutrient influx. If you’re keeping softwater species (or shrimps), take into account their extreme sensitivity to slight changes in water parameters and use the calculator for dosing trace elements.
The calculator also allows you to round down all those small doses. This ensures the accuracy of what you program goes through your dosing pump, instead of fighting fractions of drops that it can’t mechanically dispense. Failure to do this will result in inconsistent dosing, something that appears negligent despite best effort.
With the schedule generated from the tool, you get a day-by-day plan of which stages to perform, including hold days during which you stop dosing and let the water chemistry stabilize while testing catches up. I know folks like to avoid this step and return to normalcy as quickly as possible. Speed, however, isn’t worth much if you lack stability.
When your test results exceed the set baseline or you encounter a caution flag, the schedule recommends slowing down. This gives the biofiltration some time to stabilize around your new baseline so that you can proceed safely. You’re not simply pouring water into the tank, you’re engaging in an ecosystem negotiation, which might require patience.
The payoff is huge for long-term tank health even though it’s a little thing. You’ll find some handy reference tables on this page to help you choose between a conservative SPS reef or a hardier setup using planted grow-out profiles. These are just examples and each profile is assigned a daily cap that its intended livestock type can endure without signs of stress such as tissue recession, molting, etc…
Plug in your numbers (i.e. Frequency and tank volume) and let the calculator do the math to split these daily amounts up into reasonable single events. That way, you’re not exceeding the max bolus size of your pump but also achieving your desired level over time. Ultimately, we aim to do it all without anyone noticing.
The fish shouldn’t notice the dose creeping up, just the subsequent water quality improvement. Avoiding the boom-and-bust cycle of so many aquarium failures depends on being slow and sticking to limits. Letting the calculator take away the guessing part of patience gives you permission to trust the process instead of your impulses. Take a little step, see what happens, then take another, but only if the system can handle it. That’s how you create a long-lasting tank, one cautious increment at a time.