🐟 Condition Factor Calculator
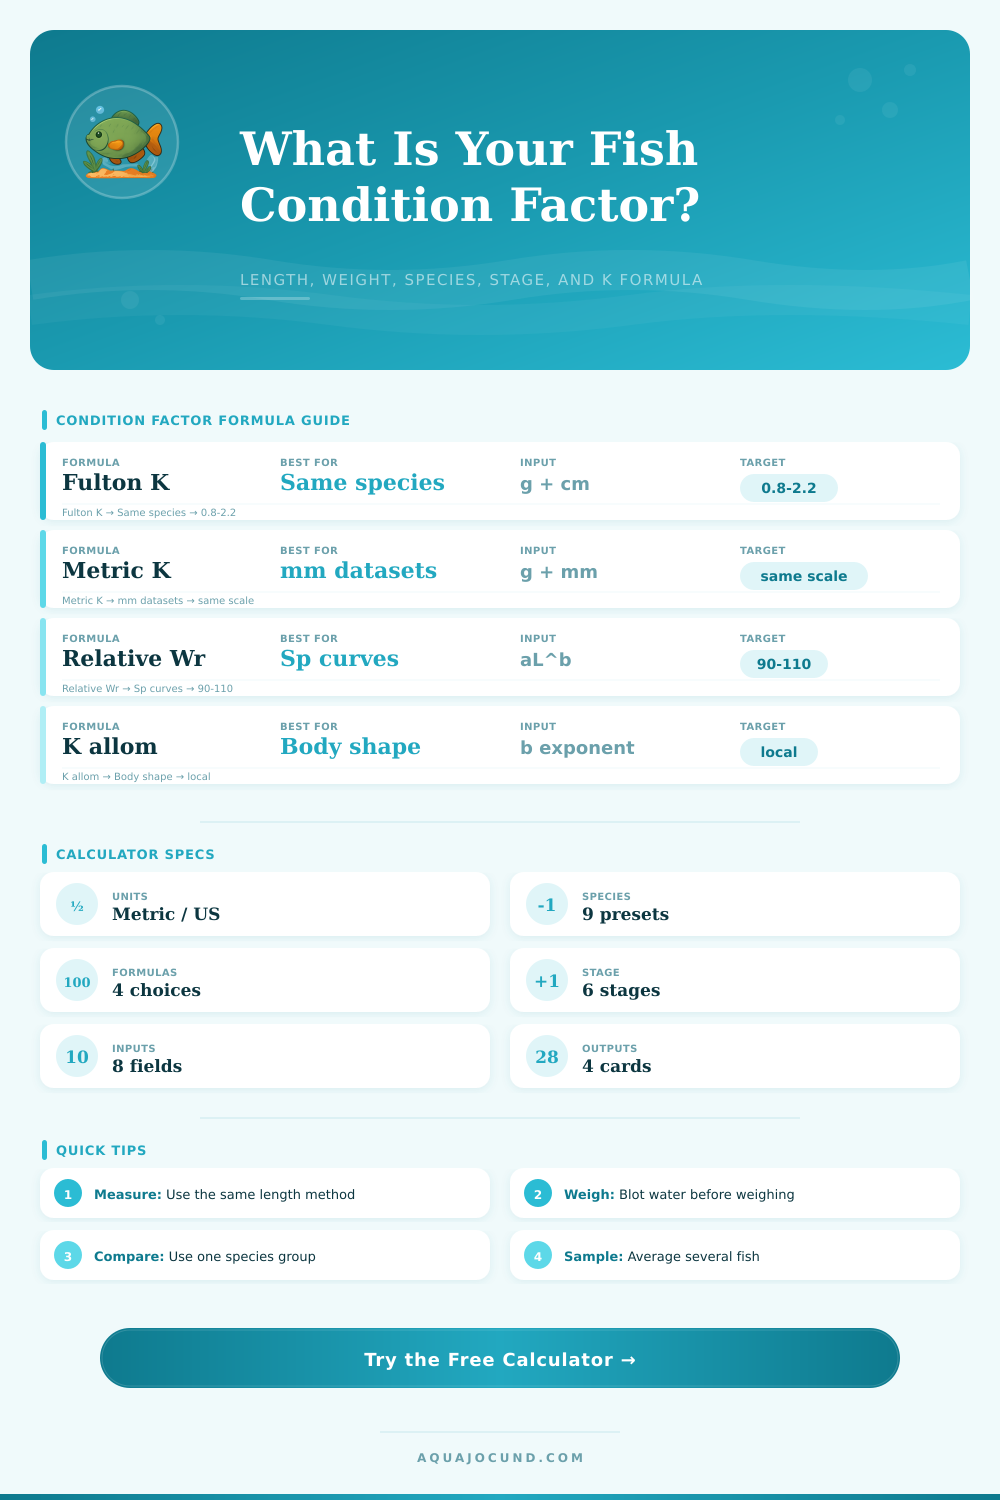
Compare fish length and weight with Fulton K, metric K, relative weight, or allometric condition math, adjusted by species body type, growth stage, sample count, and target range.
🎯Condition Factor Presets
⚙Calculator Inputs
📊Condition Factor Comparison Grid
🧬Species Body Type Quick Specs
| Species / body type | a coefficient | b exponent | Fulton K guide | Use note |
|---|---|---|---|---|
| Slender tetra / rasbora | 0.0065 | 3.10 | 0.75-1.20 | Works best as a same-school average. |
| Livebearer / small community | 0.0125 | 3.02 | 1.05-1.70 | Sex and pregnancy can shift body weight. |
| Betta / labyrinth fish | 0.0160 | 2.98 | 1.25-1.95 | Deep fins do not count as body mass. |
| Cichlid / tilapia body | 0.0180 | 2.95 | 1.55-2.15 | Good general growout comparison group. |
| Deep-bodied discus / angel | 0.0250 | 2.92 | 2.00-3.00 | Use deep-body targets, not slender-fish targets. |
| Goldfish | 0.0220 | 3.03 | 1.80-2.80 | Fancy types often run above common forms. |
| Koi / common carp | 0.0195 | 3.05 | 1.60-2.45 | Season and temperature affect comparisons. |
| Troutid | 0.0105 | 3.03 | 0.95-1.45 | Often recorded with fork length in datasets. |
📐Formula Reference Table
| Formula choice | Equation | Length unit inside formula | Weight unit inside formula | Best comparison |
|---|---|---|---|---|
| Fulton's K | K = 100W / L^3 | Centimeters | Grams | Same species and similar sizes. |
| Metric K | K = 100000W / Lmm^3 | Millimeters | Grams | Datasets recorded in millimeters. |
| Relative weight Wr | Wr = 100W / aL^b | Centimeters | Grams | Known species length-weight curve. |
| K allom | Ka = 100W / L^b | Centimeters | Grams | Samples where b is not exactly 3. |
📈Sample Size And Stage Reference
| Sample count | Confidence label | Recommended use | Target caution |
|---|---|---|---|
| 1 fish | Individual check | Track a named fish over time. | Do not compare too strongly to a population. |
| 2-4 fish | Small snapshot | Quick tank check when handling is limited. | One outlier can move the average. |
| 5-9 fish | Useful sample | Small group or growout batch comparison. | Keep species, size, and sex mixed consistently. |
| 10+ fish | Stronger batch | Breeding, growout, and pond record keeping. | Still separate sizes and body types when possible. |
| Growth stage | Target adjustment | Use case | Reading note |
|---|---|---|---|
| Fry | -8% | Very small fish | Small measurement errors change K quickly. |
| Juvenile | -3% | Fast growth | Length often moves faster than weight. |
| Growout | 0% | Batch tracking | Best general-purpose stage. |
| Adult maintenance | 0% | Stable display fish | Compare to the same season if possible. |
| Breeder conditioning | +5% | Pre-spawn records | Gravid females can score high. |
| Cool-season holding | -4% | Ponds and low feeding | Temperature and feeding history matter. |
How much does it weigh? That’s where condition factor comes in. Condition factor take into account an animal’s weight (or mass) and length. If a fish seems robust but is actualy underfed, or vice versa with excess fat, condition factor strips away the visual noise to help you track health trends.
By inputting your measurements into the calculator, you don’t have to guess around with any coefficients. It does all of the math for you. As an object gets longer, its volume increases at a cubic rate; therefore, Fulton’s K formula divide weight by the cube of length. Volume increase dramatically with length. If you have a ten centimeter fish and then a twenty centimeter one, and it maintains proportional body shape, it will weigh eight times more than original. Any variation from this graph would indicate a different level of condition.
What Is Condition Factor?
It’s not magic but a good way to see trends over time. Each species also swims differently; not all fish are alike. For example, a deep-bodied discus will not be similar to a long, narrow tetra because of their different body shape and swim bladder positions. There are built-in presets for this. Normally, a streamlined rasbora will have a lower condition factor then a natural cichlid with a rounded, more compact shape. If you set the wrong baseline, then you run the risk of a false alarm. And that’s where folks tend to miss a step, they forget to choose the right category of fish.
Consistency matters, which is why precision is important. For length measurements, either standard or total, choose a method and use it each time out. Don’t mix things up; it will skew your data points and mask any trend you may be looking at. With weighing, there is an added concern. If the fish has been in the water, that water will add weight. Be sure to blot the fish off so only its actual body weight goes onto scale. That little step makes all the difference in the accuracy of your record.
Larger samples increase the reliability of measurements due to removal of outlying individuals. If I only measure one fish, it’s just a snapshot and not necessarily representative of the population. When I take 8-10 fish and average them, it give me a better idea of how well the population is doing. That can be especially helpful in ponds or in growout stages where different individual fish are affected by stressors differently. The reference tables illustrates how bigger sample sizes will stabilize the measurement. The more you count, the more confident you’ll feel about adjusting feedings.
Remember that these numbers represent averages, affected by season and life stage. Metabolism slow during the cooler months of the year, causing fish to go out of condition. Pre-spawn breeders will hold excess body weight before spawn, resulting in higher scores compared to maintenance adults. Don’t let this fool you into either panicking or getting complacent. You’re seeking trends in a given timeframe, not absolute perfection.
Now condition factor is more comparative than evaluative. A high condition number doesn’t necessarily indicate a happy fish. And a low condition number doesn’t necessarily indicate an ill fish either. Its value comes into play as a way to track changes in your population over time (changes from water quality changes, feed changes etc.). Consistency is key. Your measures need to represent reality and not error. So keep your conditions consistent and accept the body form of your species.
Knowing how much a fish of a certain length should of weigh compared to others tells you if a fish is thriving. It is more than just gazing upon them.