CO2 to Bicarbonate Calculator
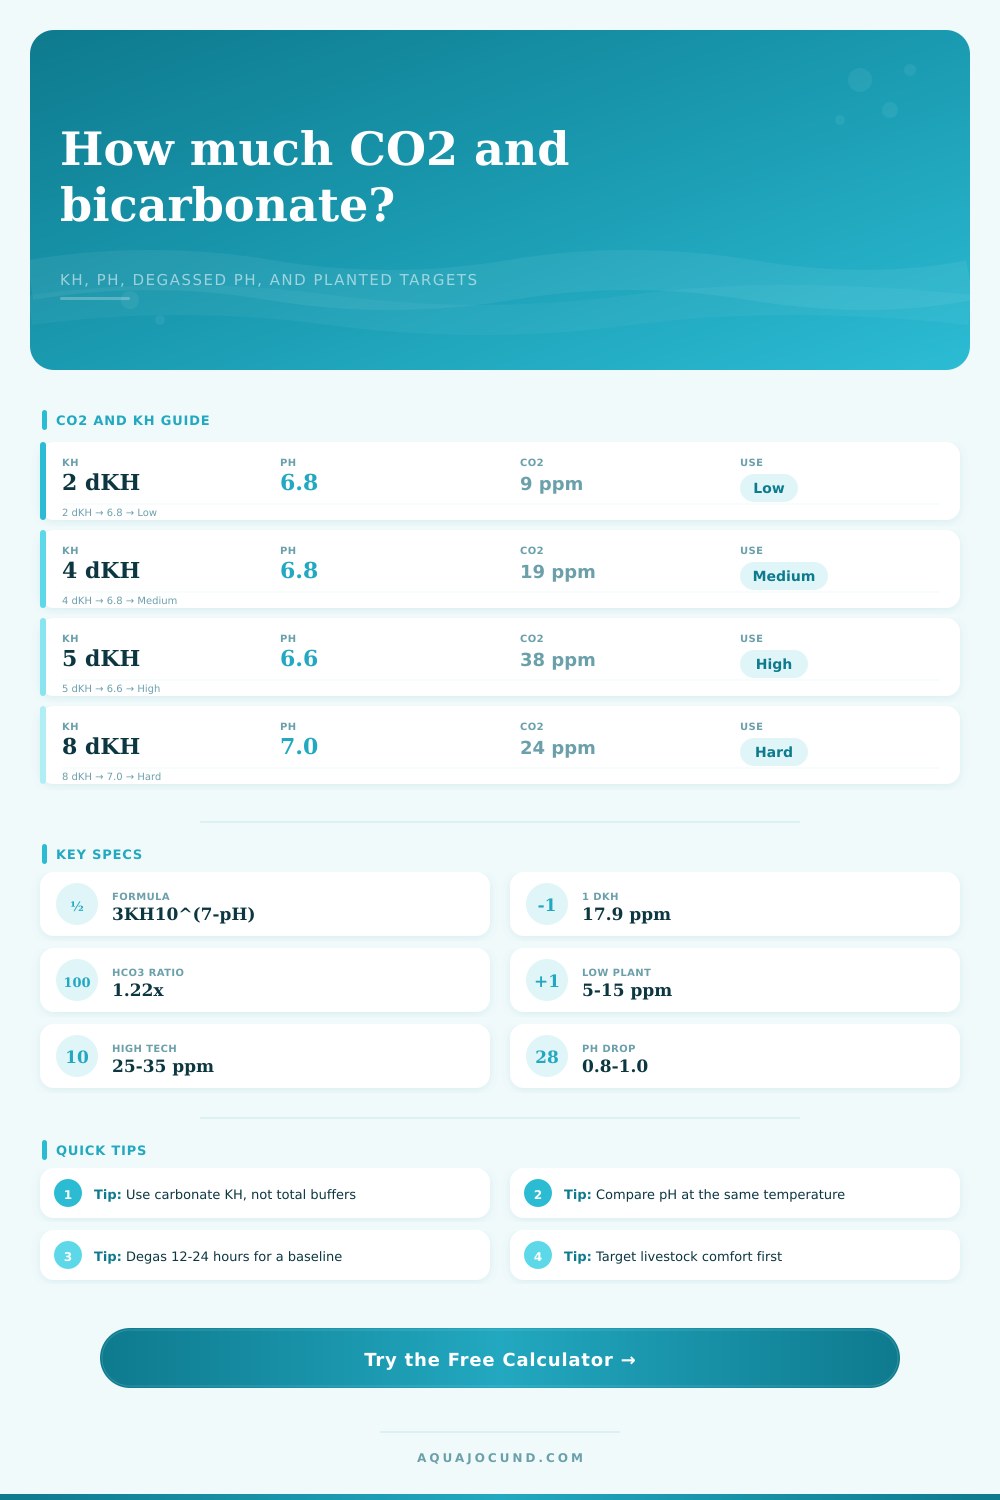
Estimate dissolved CO2, bicarbonate alkalinity, KH reliability, degassed pH drop, and planted tank target fit.
| KH and pH case | CO2 ppm formula | Alkalinity as CaCO3 | HCO3 estimate |
|---|---|---|---|
| 2 dKH at pH 6.8 | 9 ppm | 35.7 ppm | 43.5 ppm |
| 4 dKH at pH 6.8 | 19 ppm | 71.4 ppm | 87.1 ppm |
| 5 dKH at pH 6.6 | 38 ppm | 89.2 ppm | 108.8 ppm |
| 8 dKH at pH 7.0 | 24 ppm | 142.8 ppm | 174.2 ppm |
| Tank style | Target CO2 | Degassed pH drop | Reading note |
|---|---|---|---|
| Low tech planted | 5-15 ppm | 0.2-0.5 pH | Usually no injection |
| Low light injected | 15-25 ppm | 0.5-0.8 pH | Moderate plant demand |
| Medium planted | 20-30 ppm | 0.7-1.0 pH | Common target band |
| High tech carpet | 25-35 ppm | 0.9-1.2 pH | Watch livestock response |
| Sensitive livestock | 8-18 ppm | 0.3-0.7 pH | Use a gentler ceiling |
| Tank | Dimensions | Volume | CO2 mass at 30 ppm |
|---|---|---|---|
| 5 gal nano | 16 x 8 x 10 in / 41 x 20 x 25 cm | 5 gal / 19 L | 0.57 g dissolved |
| 10 gal | 20 x 10 x 12 in / 51 x 25 x 30 cm | 10 gal / 38 L | 1.14 g dissolved |
| 20 long | 30 x 12 x 12 in / 76 x 30 x 30 cm | 20 gal / 76 L | 2.27 g dissolved |
| 40 breeder | 36 x 18 x 16 in / 91 x 46 x 41 cm | 40 gal / 151 L | 4.54 g dissolved |
| 75 gal | 48 x 18 x 21 in / 122 x 46 x 53 cm | 75 gal / 284 L | 8.52 g dissolved |
| 125 gal | 72 x 18 x 21 in / 183 x 46 x 53 cm | 125 gal / 473 L | 14.20 g dissolved |
| Profile | KH reliability | Bicarbonate meaning | Best comparison |
|---|---|---|---|
| Standard tap KH | High | Mostly carbonate alkalinity | KH, pH, degassed pH |
| Injected planted tank | High | Good for target tuning | KH and pH drop |
| Active aquasoil | Medium | Acids can depress pH | Degassed pH trend |
| Blackwater acids | Low | KH may not explain pH | Direct CO2 if available |
| Phosphate buffered | Low | Non-carbonate alkalinity high | Measured CO2 and livestock |
| Limestone hardwater | High | Bicarbonate usually strong | KH and pH baseline |
| Cichlid carbonate mix | High | High alkalinity buffer | KH trend over time |
| Marine or reef alkalinity | Medium | Carbonate share is higher | Use reef alkalinity context |
The initial experience most hobbyists have with adding dissolved co2 to their tank was probably when they used their sump or canister as a reactor. They bought the reactor and hooked up the regulator. After reading a blog post they were confident that all those bubbles would dissolve into water. So they tested the pH. Hmmm. That doesn’t look right.
The calculator says there should be 20 ppm of CO2 in the water. However, the pH hasn’t moved at all. Maybe the kh test is off or maybe the co2 isn’t dissolving. Maybe it’s chasing a ghost. Most of the time the issue isn’t the equipment. It’s nearly always the math behind the chemistry.
Why You Should Stop Watching Bubbles
On paper its an elegant relationship between pH, carbonate hardness and dissolved carbon dioxide. In practice? It is messy. Fortunately the calculator do all the math for you. Know what the inputs mean for your tank.
KH isn’t simply a number from a test strip. KH represents your alkaline buffer capacity; those thing that hold your pH steady. Primarily these are carbonates and bicarbonates. They act as a shock absorber for pH. Injecting CO2 add carbonic acid. What happens to that acid?
If your KH is high, the acid gets neutralized. Your pH remains high. Low KH? Yes. Your pH plummets. Quickly. Not good, especially if you have livestock. Stress and death may follow.
And this is why I harp on the degassed pH input. Hobbyists mostly ignore it. But it’s the best anchor you’ve got. How do you get it? You take a water sample and aerate it hard for twelve to twenty-four hours. All the dissolved CO2 comes out. The pH is the real deal then. Compare that high reading to the pH in your running tank. The difference indicates the amount of CO2 pressure you’ve added.
Zero point eight to one point zero pH units indicates healthy CO2 injection. Less than that and you’re probably not getting your gas to dissolve very well. More then that and you may be overfeeding the plants. You may be suffocating the fish.
Also, it will break out the bicarbonate estimate. Why does this matter? Because now you can see how much actual alkalinity is in the water. Calcium carbonate make up a little over 17 ppm per dKH. So basically its about 1.22 times that amount. When you’re dosing supplements, this is important. When you’re balancing trace elements, this is important as well.
You’ll find that certain waters (blackwater extract with lots of organic acids and phosphate buffers) makes the standard KH calculation less accurate. With this tool, you have a chance to correct for such profiles. Not all buffers are created equal.
The problem I see is that people lock into one particular number for CO2. Thirty ppm, according to the tech gurus, is good. But the plants don’t care what the number is. The plants care if it’s available. In a low-tech set-up, they may never see more than 5-15 ppm. However, the balance of nutrients and light means the plants thrive. Pumping all sorts of CO2 into a low-tech tank is wasting resources. It can even be toxic.
This table on this page shows target bands. The key point is the concept of balance. Match the amount of CO2 to the light level. Also match it to the flow rate. If there isn’t enough light, but you crank up the CO2, you’re just making a mess. If you have too little light and lots of CO2, you are being inefficient.
Consider the temperature, too. Gas dissolves more easy into cold water than it does warm water. So, if you have a seventy-degree tank with shrimp, you’re going to see a higher CO2 ppm. A tropical display running at eighty-two will have less. That’s why the calculator seeks out your temperature. It is not because of how the fish like it, but because it affects the solubility coefficient. Without taking this into account, you might wrongly believe that you are under-dosing. It is just physics in action.
So what does all this mean? Ultimately, it means using both calculation and observation. The math gives you a map, but you have to let the tank tell you if it is right. Not calculation. Observe the plants. Does new growth look yellow? (That’s a sign of being carbon limited.) Is the pH going down faster than you like? (That’s a sign of low buffering.) Use the tool as a starting place. Let the tank tell you if it’s right or not.
The math provides a map. It’s the fish and plants who do the walking on the terrain. Make adjustments slowly. Test frequently. Keep in mind that it’s more important for your tank to be stable than perfect. A moderately consistent level of CO2 is much better than wildly fluctuating levels of CO2. When you notice the plants begin to green-up then you’ve dialed into the sweet spot. The livestock will behave normaly.
It is time to stop watching those bubbles. It is time to start enjoying the view.