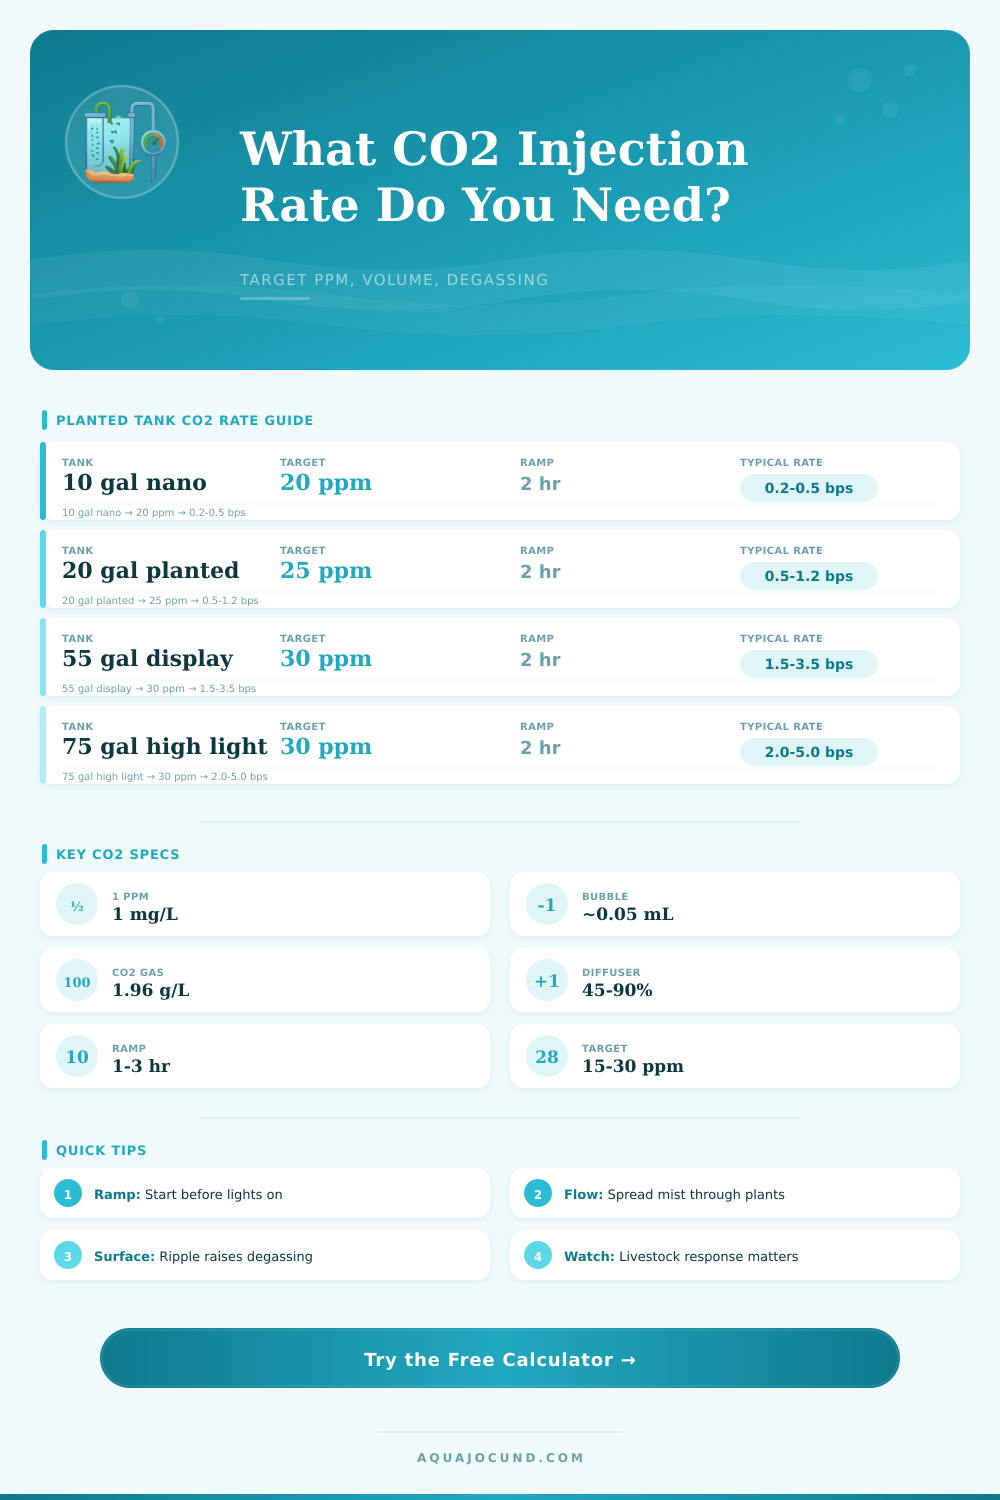
CO2 Injection Rate Calculator
Estimate planted aquarium CO2 ramp rate, bubble count, daily gas use, and maintenance dosing from target ppm, volume, degassing, diffuser efficiency, and ramp time.
🌱Planted Tank Presets
⚙CO2 Rate Inputs
CO2 Injection Estimate
🧪Injection Method Comparison Grid
📊CO2 Method Efficiency Reference
| Method | Typical efficiency | Best use | Calculator note |
|---|---|---|---|
| Glass ceramic diffuser | 55-75% | Nano to mid-size display tanks | Fine mist, depends heavily on circulation |
| Inline atomizer | 75-90% | Canister filter returns | Good contact time with visible mist |
| External reactor | 90-98% | Larger planted tanks | Very efficient when not burping gas |
| Powerhead misting | 60-80% | High-flow aquascapes | Can work well with broad distribution |
| Ladder diffuser | 35-55% | Small low-energy tanks | Lower dissolution at higher rates |
| Bell diffuser | 20-40% | Very gentle or temporary setups | Slow surface contact, limited control |
| Sump return injection | 45-70% | Sumped planted displays | Efficiency drops with overflow turbulence |
🌊Degassing and Surface Movement Guide
| Surface condition | Degassing rate | Typical setup | Planning note |
|---|---|---|---|
| Very calm surface | 8-15% per hour | Low flow, little ripple | Lower gas use, lower oxygen exchange |
| Light ripple | 15-25% per hour | Most small planted tanks | Balanced starting estimate |
| Moderate agitation | 25-40% per hour | Spray bar, lily pipe, stronger return | Needs more maintenance injection |
| Overflow or sump | 40-70% per hour | Weir, wet-dry, open sump | High loss during the photoperiod |
| Air stone running | 50-90% per hour | Aeration on during CO2 | Usually raises required rate sharply |
📐Common Tank Size CO2 Examples
| Tank size | Water volume | 20 ppm increase | 30 ppm increase |
|---|---|---|---|
| 10 gal nano | 38 L | 0.76 g dissolved | 1.14 g dissolved |
| 20 gal long | 76 L | 1.51 g dissolved | 2.27 g dissolved |
| 40 breeder | 151 L | 3.03 g dissolved | 4.54 g dissolved |
| 55 gal display | 208 L | 4.16 g dissolved | 6.25 g dissolved |
| 75 gal display | 284 L | 5.68 g dissolved | 8.52 g dissolved |
| 120 gal display | 454 L | 9.08 g dissolved | 13.63 g dissolved |
⏱Target and Ramp Planning Table
| Target range | Common ramp | Use case | Adjustment cue |
|---|---|---|---|
| 10-15 ppm | 2-3 hr | Low light, shrimp, gentle tanks | Use small changes and watch behavior |
| 15-25 ppm | 1.5-2.5 hr | Moderate planted aquariums | Stable drop checker color by lights on |
| 25-30 ppm | 1-2 hr | High light growth tanks | Requires strong flow and observation |
| 30+ ppm | Slow careful tuning | Advanced plant-focused layouts | Do not chase ppm if livestock react poorly |
Perhaps you’ve got a well-lit planted tank that’s lacking pep in its step. It’s annoying. Everything appear to be in order on paper, but the water just doesn’t seem right. One key ingredient is frequenty carbon dioxide. But adding any amount is something you shouldn’t do without knowing what you’re doing. If there is not enough CO2, algae will grow. Too much CO2 will kill your fish and other livestocks.
So what’s the difference between knowing and guessing? You bridge this knowledge gap by knowing how much CO2 is in your water, how fast it’s changing, and how much your water can holds. Carbon dioxide is not a liquid nutrient, but most hobbyist assume it works like one where more is good for plant growth. However, unlike a liquid additive, dissolved gas want to leave the water just as fast as it enters it. Because this exchange. Dissolving and exiting via degassing (happen constantly), we need to do some math.
How to Add CO2 Safely
Fortunately, the complex math of partial pressure gradients and Henry’s Law are handled by this tool for you. Instead of deriving these equations yourself, simply enter the amount of water you intend to dose, then the concentration you desire, and the tool will calculates the injection rate needed to achieve that goal physically. A common error is that many people only consider target concentration without considering how long it will take to reach that level.
One thing that’s not always understood by users of the interface are the ramp time, which determines how long it takes to reach the target concentration. Rapid shifts is hard on plants. If you slam-dunk a twenty gallon tank full of water that suddenly has thirty parts per million, your pH is going to plummet fast. Your fish will struggle with adapting to different blood acidity levels, becoming lethargic and even gasping at the surface. By implementing a soft ramp across two hours, the ecosystem can acclimated slowly. The ramp period is included in the calculated hourly gas demand to ensure enough volume is delivered without causing an abrupt burst that leads to overshoot.
The other thing that become clear as you watch your cylinder consumption or compare prices between two supplier is that there are differences in diffuser efficiency. Water flow rate matter, and not every injection method is created equal. If it’s too gentle for the water, a ceramic stone will produce a nice mist but those little gas bubbles dissapears rapidly. They don’t have time to lose much gas before they hit the water’s surface. On the other hand, inline reactors forces gas along a long wet journey, greatly increasing its dissolution rates. If you glance across the page, you’ll see why your old bell diffuser may be wasting half of your supply while the new atomizer is keeping money in your pocket.
One big reason for parameter instability is degassing, which is movement of gas between the aquarium and the air. An active surface (e.g., spray bar, overflow box) will enhance this process and rob CO2 from the water before the plants can grab it during photosynthesis. The calculator adjust accordingly, knowing that increasing concentration is more difficult then maintaining it. So while spiking may be straightforward, sustaining it in the face of atmospheric pressure are not so simple.
Keep in mind, start with conservative targets and monitor your livestock carefully for signs of distress. Your animals will let you know if they’re stressed by your water. Droplet checkers give color cues, but behavior tells the truth. If they seem distressed (e.g., fish, shrimp hovering at the surface), reduce the injection rate immediately.
Remember… These are estimates from an ideal situation. You have other unique variables to deal with such as biological demand and temperature fluctuation that any algorithm can’t possibly account for perfectly. Treat it as a starting point not a definite “do it”. The idea isn’t that there’s a magic number for co2. It’s that there’s a happy medium at which the fish aren’t stressed, yet everything grow well.
When you know how to calculate the inputs, it’s no longer guess work; it becomes tune. And as the plants get exactly what they require, instead of being subjected to the hassle of experimentation, they’ll reward you with increased growth (both height and color). The water column has its own rules of physics and treating them accordingly lead to success.