Central Filtration System Volume Calculator
Estimate display bank volume, sump operating water, pipe volume, media chamber water, pump-off drain-down, reserve freeboard, and system turnover.
📏Display tank bank
Measure the water level drop from running level to the overflow teeth or siphon-break stop.
🚰Sump sections and freeboard
⚙Piping, media chambers, and flow
Use delivered return flow after head loss for turnover, not the pump label rating.
Calculation breakdown
🔧System design comparison grid
📊Reference tables
| Pipe true ID | Water per ft | Water per meter | Common use |
|---|---|---|---|
| 3/4 in / 19.1 mm | 0.023 gal | 0.285 L | Small returns and branch feeds |
| 1 in / 25.4 mm | 0.0408 gal | 0.507 L | Rack returns and compact loops |
| 1 1/4 in / 31.8 mm | 0.0638 gal | 0.792 L | Medium central return headers |
| 1 1/2 in / 38.1 mm | 0.0918 gal | 1.139 L | Drains and larger return headers |
| 2 in / 50.8 mm | 0.163 gal | 2.027 L | Main drain trunks and fish room manifolds |
| 2 1/2 in / 63.5 mm | 0.255 gal | 3.167 L | Large gravity drain trunks |
| Media chamber type | Water fill used | Why it differs | Planning note |
|---|---|---|---|
| Loose biomedia chamber | 70% | Void space remains between rings, balls, or loose blocks. | Use for baskets and broad-flow chambers. |
| Static block biomedia | 82% | Open-pore blocks displace less water than packed loose media. | Good default for ceramic blocks and plates. |
| Moving bed reactor | 65% | Media plus air movement leaves working headspace. | Do not fill to the lid. |
| Sponge tower | 55% | Sponge foam displaces more water as pores load. | Clean condition changes volume slightly. |
| Carbon or GFO reactor | 72-78% | Granular media displaces water in the canister. | Keep enough space for tumble when needed. |
| System type | Display bank | Sump operating target | Freeboard target |
|---|---|---|---|
| Nano rack | 4 to 8 small displays, 10 to 25 gal each | 25% to 40% of display volume | Display drop plus pipe drain-down |
| Breeder or grow-out wall | 6 to 16 tanks, 20 to 40 gal each | 20% to 35% of display volume | 20% margin above calculated drain-down |
| Retail holding system | 12 to 40 connected cells | 25% to 45% of display volume | Large reserve for restart and maintenance |
| Frag or coral farm | Shallow trays or vats | 30% to 50% of display volume | Wide shallow trays can drain a lot per inch |
| Remote basement sump | One or more displays above sump | As large as space allows | Include vertical return plumbing drain-back |
| Component | Volume formula | Imperial factor | Metric factor |
|---|---|---|---|
| Rectangular tank or sump | L x W x H | cubic inches / 231 = gal | cubic cm / 1000 = L |
| Cylinder chamber | Pi x radius squared x height | cubic inches / 231 = gal | cubic cm / 1000 = L |
| Pipe volume | Pi x ID squared / 4 x length | 12 in per ft, then / 231 | 100 cm per meter, then / 1000 |
| Display drain-down | Surface area x water drop | cubic inches / 231 = gal | cubic cm / 1000 = L |
| Turnover | Delivered flow / operating volume | gph / gal = x per hour | L/h / L = x per hour |
💡Central volume tips
Even if you have a rack of twenty same sized tanks, that doesn’t tell you how much water flows through your system. That’s a quiet trap of central filtration. It sounds like plumbing but it acts like hydrology. Volumes is hidden and the difference between having an efficient loop and creating an unstable mess can depend on these volumes. Aquarists don’t typically measure these volumes…until something goes wrong.
Sure, you got eight twenty-gallon tanks so you think you’ve got a total of 160 gallons. Oh yeah, and there’s that dead space in the sump. Those pipes contains water. Those media chambers take up volume according to how they’re packed. It all adds up and alters how quickly your pump cycle water. Once you input your dimensions the calculator does all the math for you. You won’t need conversion factors or has to guess on coefficients.
Why You Need to Measure Water Volume
It starts with something most folks don’t think about: the display bank. Simply input the number of tanks and shape, followed by operating depth. Why? Because unless you have a 30 inch tank full of water there are likely some corals, sand, or gravel inside it. Even more importantly you must factor in the drain-down drop. Those displays don’t maintain their overflow rim water level when the return pump shuts off. The water falls as far as the siphon breaker or teeth allow.
Now you’ve got that column of falling water which doesn’t just dissapears. It surges through your pipes and sump. You must calculate the surge volume. Without that calculation, your sump may run perfectly fine under normal circumstances but overflow whenever someone flips a switch. Why does it matter? Because that’s what causes that surge. Maintenance restarts occur. Power outages happen.
While it may be efficient to only add a bare minimum reserve on paper, real life doesn’t always cooperate. Having a twenty to thirty percent margin added to your reserve will ensure that when your system restarts after a blackout, you won’t find yourself with empty displays waiting for gravity to do its work. The tool calculates your drain-down and compares that value against the available airspace of your sump above operating level to factor this in. It tells you whether you’re walking a tightrope or whether you’re safe.
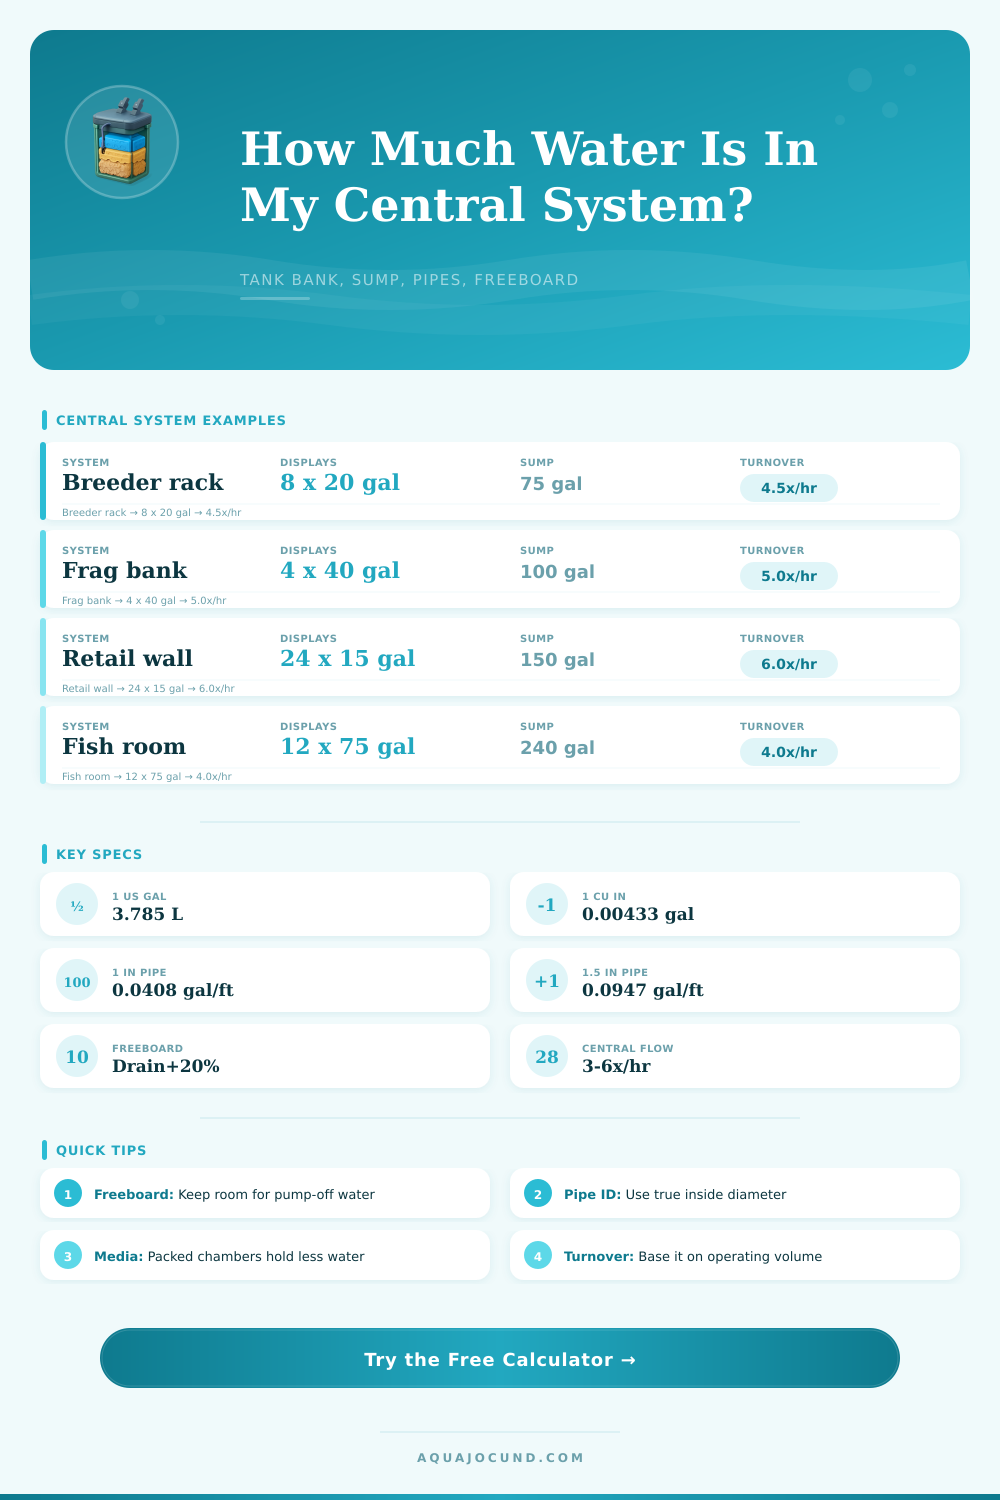
Another quiet volume hogs is your pipes. People often forget about the water in the drain and returns until someone tries to explain why the flow seems slow. One inch of water in a foot of pipe will hold around four hundredths of a gallon. If you add 30’of return pipe and 24’of drain pipe and double it because you have two of every pipe size, you have several gallons of water parked in PVC pipe. That’s water that isn’t circulating and getting filtered. It’s simply dead weight on the loop. The chart on the page does a good job of explaining what happens as you increase pipe size from three quarter inch tubing to say two inch mains. How quickly do those volumes adds up?
Another wrinkle is that media chambers aren’t always entirely filled with water. Loose ceramic blocks or other biomedia will leave some holes in a chamber. For this reason, the calculator accounts for the fact that not all the volume in the chamber are water. That means that you have a 65% volume on a moving bed reactor. Sixty five percent of what? The answer is the part that’s water. There’s no water in the parts where air moves through the media or the material. So don’t count that displacement when calculating how much volume is realy in use. Your real volume is less than you think. You could think you’re exchanging six times an hour. But if your medium displaces half a chamber’s worth of volume, then maybe you’re only exchanging four. The math isn’t hard to grasp but it does matter.
That’s the final result of all those inputs, turnover. Turnover takes your delivered flow rate and divides it by total operating volume. Typically, most people looking at low energy loops with separate circulation pumps in their tanks will go slower. Three to six times an hour is typically where you should be aiming for most systems (retail walls, breeding racks). Higher exchange rates is needed on dense holding environments. You don’t want waste building up! But speed isn’t the objective here. Stability is.
A well-sized system doesn’t spill when there’s a drain-down surge. It provides enough circulation to keep levels steady while still providing enough space in the sump to allow skimmers or other mechanical filtration to do their thing. It transforms a series of disconnected buckets into one, cohesive whole. When the lights go out, you want to be certain that organism remains healthy. And getting the volume right is how you’re going to do that. You should of accounted for this earlier.