Brackish Salinity Mix Calculator
Plan marine salt for brackish aquariums from freshwater TDS, target ppt or SG, tank volume, species zone, salt yield, temperature, and staged water changes.
🎯Quick Presets
⚙Calculator Inputs
📊Brackish Zone Snapshot
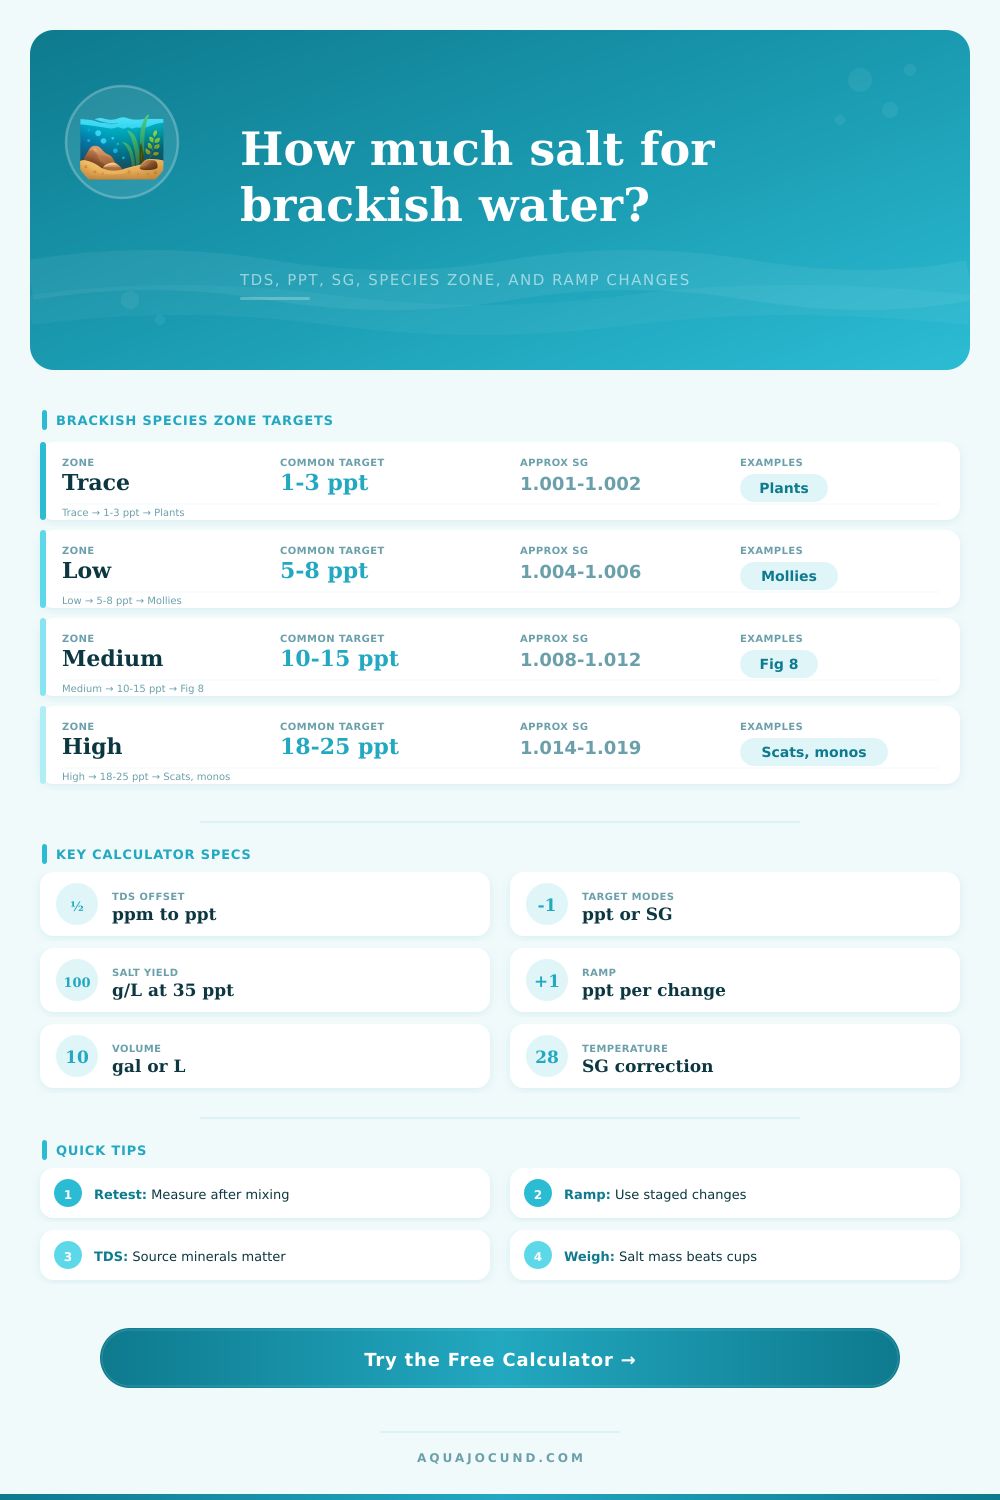
🐟Brackish Species And Zone Comparison
| Species or group | Practical zone | Common ppt range | Approx SG at 77°F | Ramp note |
|---|---|---|---|---|
| Poecilia mollies | Low brackish | 3-8 ppt | 1.002-1.006 | Often tolerant, but still stage changes. |
| Bumblebee gobies | Low to medium | 5-12 ppt | 1.004-1.009 | Stable moderate brackish is easier to match. |
| Fig 8 | Medium brackish | 8-15 ppt | 1.006-1.012 | Use small measured ramps and retest. |
| Knight gobies | Medium brackish | 6-15 ppt | 1.005-1.012 | Keep replacement water predictable. |
| Archerfish juveniles | Medium to high | 10-20 ppt | 1.008-1.015 | Use larger systems and gradual changes. |
| Scats and monos | High brackish to marine | 15-30 ppt | 1.011-1.023 | Plan long-term rises toward marine levels. |
| Mudskippers | Estuary swing | 8-25 ppt | 1.006-1.019 | Match the chosen husbandry target before changes. |
🧂Marine Salt Yield Reference
| Salt profile | Calculator yield | 1 ppt dose | Best use |
|---|---|---|---|
| Brackish marine salt baseline | 34 g/L at 35 ppt | 0.971 g/L | Low to medium brackish systems. |
| Standard marine mix | 35g/L @35ppt | 1.000 g/L | General brackish or marine planning. |
| Reef salt mix | 36 g/L at 35 ppt | 1.029 g/L | When only reef salt is available. |
| Fish-only salt mix | 35.5 g/L at 35 ppt | 1.014 g/L | Fish-only brackish and marine tanks. |
| Natural seawater style | 34.5 g/L at 35 ppt | 0.986 g/L | Measured batch mixing. |
| Lean low-residue mix | 33.5 g/L at 35 ppt | 0.957 g/L | Conservative first estimates. |
📏Common Tank And Water Change Examples
| Nominal tank | Planning volume | Typical change | Salt for +1 ppt in change | Salt for full tank +1 ppt |
|---|---|---|---|---|
| 10 gal nano | 9 gal / 34 L | 2 gal / 7.6 L | 7-8 g | 33-35 g |
| 20 gal long | 18 gal / 68 L | 5 gal / 18.9 L | 18-19 g | 66-70 g |
| 29 gal tank | 26 gal / 98 L | 7 gal / 26.5 L | 25-27 g | 95-101 g |
| 40 breeder | 35 gal / 132 L | 10 gal / 37.9 L | 36-39 g | 128-136 g |
| 75 gal estuary | 66 gal / 250 L | 15 gal / 56.8 L | 54-58 g | 243-257 g |
🌡PPT, SG, And Temperature Reference
| Salinity | Approx SG at 77°F | Approx SG at 68°F | Common label |
|---|---|---|---|
| 3 ppt | 1.0023 | 1.0019 | Trace brackish |
| 6 ppt | 1.0046 | 1.0042 | Low brackish |
| 10 ppt | 1.0076 | 1.0072 | Medium start |
| 15 ppt | 1.0114 | 1.0110 | Medium brackish |
| 20 ppt | 1.0152 | 1.0148 | High brackish |
| 25 ppt | 1.0190 | 1.0187 | Near marine transition |
⏱Staged Ramp Guide
| Situation | Typical max rise | Retest point | Calculator setting |
|---|---|---|---|
| Existing freshwater livestock | 0.5-1 ppt per change | After the tank fully mixes | Small ramp, longer days between changes |
| Hardy livebearer conversion | 1-2 ppt per change | Before the next water change | Low zone preset |
| Puffer or goby move-up | 0.5-1 ppt per change | After behavior and feeding look normal | Medium zone preset |
| New empty brackish setup | Full target allowed | After salt is dissolved and temperature matched | Use full tank target result |
So you start off with a freshwater tank and slowly work your way up to a brackish tank… but along the way, you don’t really get it. There’s more to switching than just adding some salt to the water. You have to account for the osmotic stress on your livestock. You’re attempting to recreate an estuarine environment (the area in-between fresh and marine) and this is where precise mineral balance come into play. Table salt will not cut it here. These fish require stable water conditions that can only be recreated with a designated mixing calculator.
First is knowing what you’re working with (i.e., your source water). Total dissolved solids (TDS) is measured in parts per million and there are minerals in your tap water. Before dosing anything else to your water, know what’s already there. Adding something without accounting for those base-line minerals results in overshooting your target because you’ve treated the water as though it was distilled H2O. The calculator compensates for that difference. It calculates how much salt needs to be added above and beyond your tap water to reach your target salinity. It’s not much, but it helps avoid being shocked accidental.
Why You Need a Salinity Calculator
Salinity preference is also broken down into species: certain species is more comfortable in lower (e.g., mollies), higher (e.g., scats), or marine (e.g., monocled bichirs) salinities. These are classified as high, middle, low, or trace. This means that knowing your tank’s salinity zone will tell you what specific gravity to aim for. For most hobbyists, it’s easier to get a specific gravity rather than a parts per thousand value, but specific gravity varies based off temperature. That’s why there are temperature correction values for this. If I put my hydrometer in some water and take a reading at 68 degrees Fahrenheit, it will be different then if I were to test the same water at 78 degrees. The tool handles these temperature conversions automatically so you don’t have to keep a chart handy every time you test the water. Accurately measuring here can make all the difference between a tank that thrives and one where fish end up developing ich or losing their color because of an osmotic imbalance.
Perhaps most importantly, folks overlook ramping up the salinity. Putting a freshie molly straight into full-strength brackish water will stress it out. Why? Because the fish’s kidneys and gills is immediately stressed by the density shift. They need time to adjust physiologically. So you ramp up the salinity gradually (over a few days) with ever-increasing amounts of salt added with each water change. How do you know how fast or slow to go? The calculator tells you. It gives you an acclimation plan showing you the number of days between each stage and the amount of salt to add with each water change. That way your livestock aren’t shocked but moved gradually towards ideal habitat setting. It makes this risky experiment a controlled acclimation process.
The yield profile shows that the amount of powder (grams/liter) needed to achieve a certain specific gravity vary among different marine salts. For instance, some are denser, and others include more fillers such as calcium carbonate for buffer. You can’t expect the same amount of grams per liter with a brackish blend as with a reef salt to reach ten parts per thousand. Including the proper yield profile makes the theoretical target match what is being measured in the water column. Otherwise, you may believe your tank is at the desired salinity while actualy being significantly off the mark, either over- or under-dosed.
Last but not least, think about displacement. Salt dissolves in water. As does substrate and decorations. That means that there’s less water for the salt to mix with when those things are placed in the tank. The higher the density of all those objects, the higher your salinity will be then intended because there is less water in the tank. By accounting for this, you know each gram of added salt provide the right conditions for the fish. It also ensures you aren’t just making up for an incorrect estimate of how much volume is in the tank. Taking care of these nuances makes the switch from stressed to comfortable a seamless change, leaving the salty-water residents in their ideal habitat.
You should of accounted for this earlier.