Aquarium Salt Mix Cost Calculator
Estimate salt mix cost from water volume, water change percentage, frequency, target salinity, label yield, container size, container price, loss, and reserve margin.
💧Water change schedule
Full-strength natural seawater is commonly modeled as 35 ppt.
🧂Salt container and yield
Use the prepared-water yield printed for the container.
Calculation Breakdown
📊Salt mix calculation constants
🧪Salt yield and salinity comparison grid
📋Reference tables
| Profile | Typical target | Yield basis | Cost note |
|---|---|---|---|
| Fish-only marine | 30 to 33 ppt | Often less salt per gallon than reef | Lower target salinity lowers cost |
| FOWLR full marine | 33 to 35 ppt | Full marine strength for live rock systems | Costs track close to label yield |
| Balanced reef | 35 ppt | Standard reef change-water target | Good baseline for cost per mixed gallon |
| Elevated reef | 35 to 36 ppt | Often mixed for higher major ions | Use your own label yield and price |
| Coral growout | 35 ppt | Frequent changes magnify yield differences | Reserve margin matters more |
| Brackish marine | 5 to 20 ppt | Partial-strength mixing | Container lasts much longer |
| Target salinity | Relative salt use | 160 gal label yield | 200 gal label yield |
|---|---|---|---|
| 30 ppt | 86% of 35 ppt | 187 gal / 708 L | 233 gal / 883 L |
| 33 ppt | 94% of 35 ppt | 170 gal / 643 L | 212 gal / 803 L |
| 35 ppt | 100% reference | 160 gal / 606 L | 200 gal / 757 L |
| 36 ppt | 103% of 35 ppt | 156 gal / 589 L | 194 gal / 736 L |
| 40 ppt | 114% of 35 ppt | 140 gal / 530 L | 175 gal / 662 L |
| System size | Water change | Monthly mixed water | Salt at 35 ppt |
|---|---|---|---|
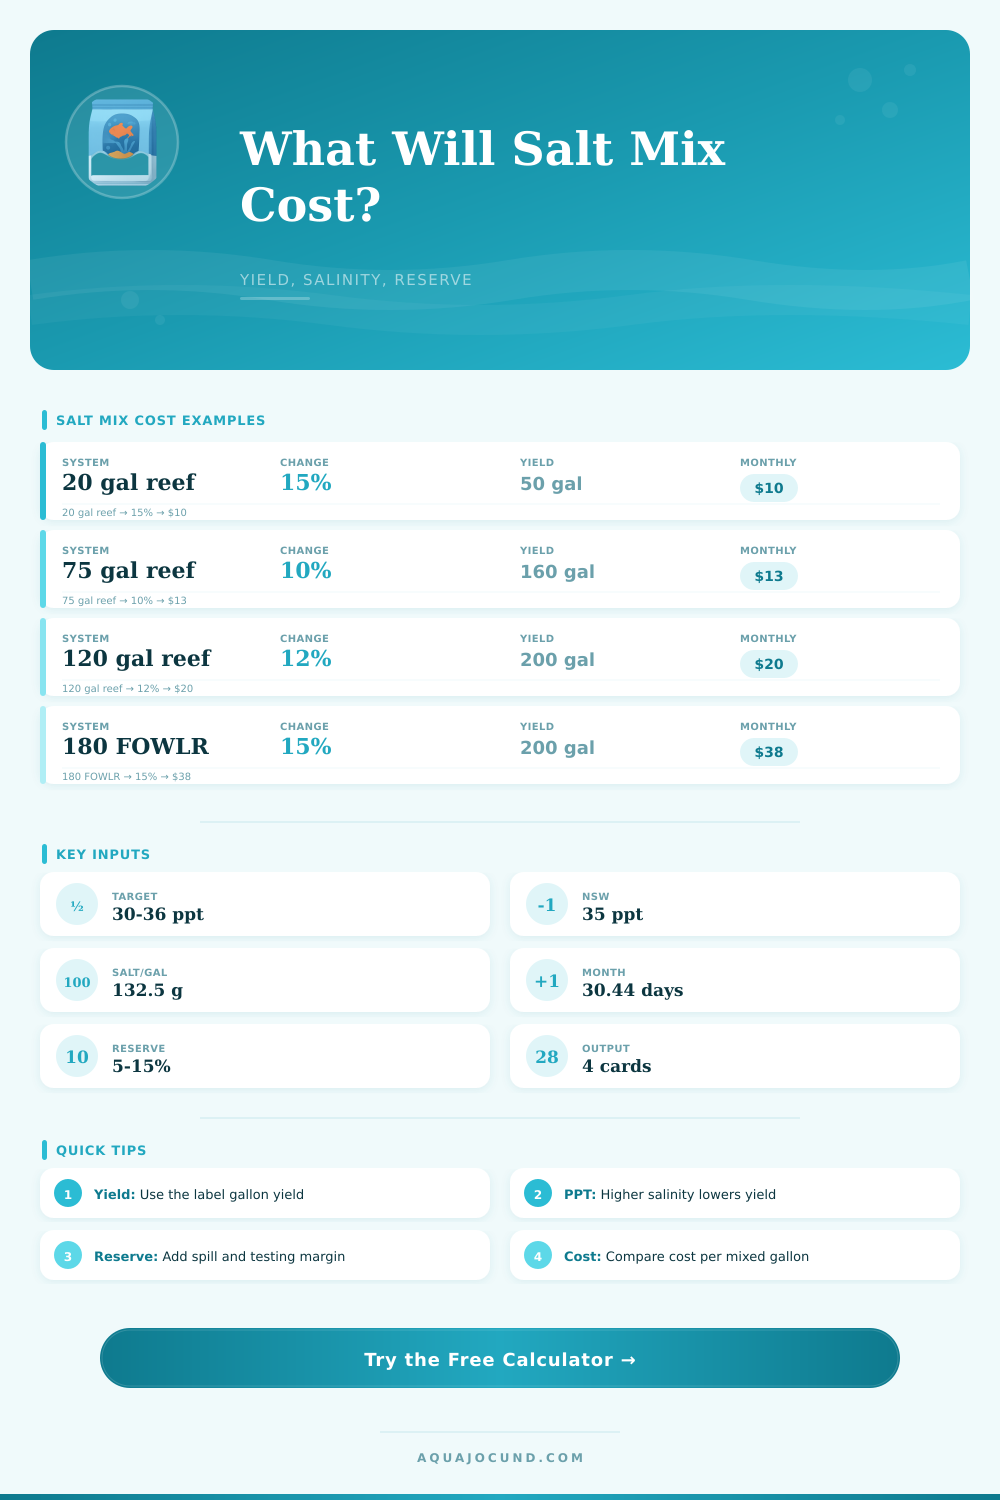
| 20 gal / 76 L reef | 15% weekly | 13.0 gal / 49 L | 3.8 lb / 1.7 kg |
| 40 gal / 151 L reef | 15% weekly | 26.1 gal / 99 L | 7.6 lb / 3.5 kg |
| 75 gal / 284 L reef | 10% weekly | 32.6 gal / 123 L | 9.5 lb / 4.3 kg |
| 120 gal / 454 L reef | 12% every 2 weeks | 31.3 gal / 119 L | 9.1 lb / 4.1 kg |
| 180 gal / 681 L FOWLR | 15% every 2 weeks | 58.7 gal / 222 L | 17.1 lb / 7.8 kg |
| Frequency | Changes per month | Example on 75 gal | Planning note |
|---|---|---|---|
| Weekly | 4.345 | 32.6 gal at 10% | Use 365.25 days per year math |
| Every 2 weeks | 2.1725 | 16.3 gal at 10% | Not exactly two per calendar month |
| Twice per month | 2.000 | 15.0 gal at 10% | Good for fixed monthly budgets |
| Monthly | 1.000 | 7.5 gal at 10% | Container lasts longer, but reserve still helps |
💡Salt mix cost tips
When establishing your marine aquarium, there’s always a sense that salt is something you’ll never need to think about again. You’ve already spent a ton of money on lighting, rock, and fish; surely a single 40lb bag of salt will be enough for all eternity. It rarely ever are. More often than not, most hobbyists tend to over-estimate their wallet but under-estimate amount of work required. That is, until it’s at the bottom of the empty salt bag.
With help of the calculator, we can connect vague feelings of anxiety with concrete dollars per month and year. The key is to know your yield. Typically, bags is labeled with a number representing how much water they hold at 35 ppt. They should yields about a hundred sixty-something gallons per bag. For natural seawater, that’s the norm.
How to Plan Your Salt Budget
For a fish-only tank, that bag yields almost nineteen gallons more (at 30 ppt). And if you need to hit 36 or 40 ppt for some corals, you’ll see your yield decrease as well. You get less but it’s not because you have a smaller bag; it’s due to concentration, not size.
There’s also maintenance chaos. While tinkering with a dripping hose, you spill some water and overfill a bucket. Then the hydrometer gave a wrong reading on one of your batches so you dump it out. The reserve margin input takes care of this type of friction. The reserve isn’t paranoid, it’s insurance. It ensures that if nitrate spike on a Tuesday night, you don’t run out of salt.
That buffer gives you insurance against imperfect mixing. Imperfect mixing always occurs when you’re in a rush. The overall spend also depends on frequency. A common misconception among many keepers are that if they switch 15% every other week, this consumes the same salt as switching 7.5% each week. Not true. Salts concentrate in the tank over time.
Evaporation removes water but leaves the salts behind. Fresh mix needs to be added to dilute those concentrating nutrients. The tool handles the conversion for you based off standard calendar math. Enter your water change frequency, and it will project your cost without needing a spreadsheet.
The key to smart shopping is to consider cost per prepared gallon, rather than just price per pound. The price tag may be lower or the bag may weigh less so a budget brand appears cheaper. However, you’ll get fewer gallons of usable water from that bag. Your true cost will increase with each gallon you must make up. Know the truth by dividing container price by yield at your salinity.
Though the initial cost might be higher, some pricey brands needs less reserve margin, and they’re more consistent. Inconsistency costs you money long term. Until you’re standing in the middle of the store with nothing but air in your hands, you tend not to think about that stuff. Then after tracking down how much salt you still have compared to how much you use, the worry subsides.
Now you always know how much your livestock cost per year to maintain (and roughly how much longer those fish will last if you don’t order more). That’s the objective, maintaining the tank while never being surprised by your bank account. You should of tracked it sooner. Monitor your salinity target, buy one extra bag to store in your closet, and let the math take care of everything else so you can spend time caring for your critters.