Aquarium Oxygen Depletion Time Calculator
Estimate how long dissolved oxygen may stay above a selected safety threshold from starting DO, system volume, livestock biomass, plant load, and aeration status.
🐟Real Aquarium Presets
🧪Dissolved Oxygen Inputs
Oxygen Depletion Estimate
📊Oxygen Demand / Species Comparison Grid
🐟Respiration Class Reference
| Class | Example livestock | Base demand | Use when |
|---|---|---|---|
| Labyrinth / low | Betta, gourami, very light stock | 140 mg/kg/hr | Slow fish with low biomass |
| Nano fish | Rasbora, tetra, shrimp mix | 220 mg/kg/hr | Small peaceful livestock |
| Community | Tetras, livebearers, corydoras | 300 mg/kg/hr | Standard tropical community |
| Active swimmers | Barbs, danios, wrasses | 430 mg/kg/hr | Fast moving fish or warm water |
| Goldfish / koi | Goldfish, koi, heavy grazers | 520 mg/kg/hr | High biomass, high waste fish |
| Predator / growout | Oscars, large cichlids, fry growout | 700 mg/kg/hr | Large fish or dense holding |
🌡Temperature and Salinity Oxygen Reference
| Condition | Freshwater saturation | Marine 35 ppt estimate | Depletion effect |
|---|---|---|---|
| 68°F / 20°C | 9.1 mg/L | 7.4 mg/L | Higher starting reserve |
| 74°F / 23°C | 8.6 mg/L | 7.0 mg/L | Typical community range |
| 80°F / 27°C | 7.9 mg/L | 6.5 mg/L | Demand rises, reserve shrinks |
| 86°F / 30°C | 7.5 mg/L | 6.1 mg/L | Shorter depletion time |
⚙Aeration Status Factors
| Aeration status | Exchange factor | Calculator meaning | Typical use |
|---|---|---|---|
| No aeration | 0.00/hr | No replacement credit | Power outage or sealed container |
| Weak ripple | 0.05/hr | Small oxygen replacement | Low return flow or open lid |
| Battery air stone | 0.18/hr | Useful emergency exchange | Outage backup |
| Filter running | 0.24/hr | Moderate surface renewal | Normal HOB or canister return |
| Skimmer / overflow | 0.50/hr | Strong gas exchange credit | Reef systems and sumps |
📐Common Tank Depletion Benchmarks
| Tank | Example biomass | Typical threshold | Planning note |
|---|---|---|---|
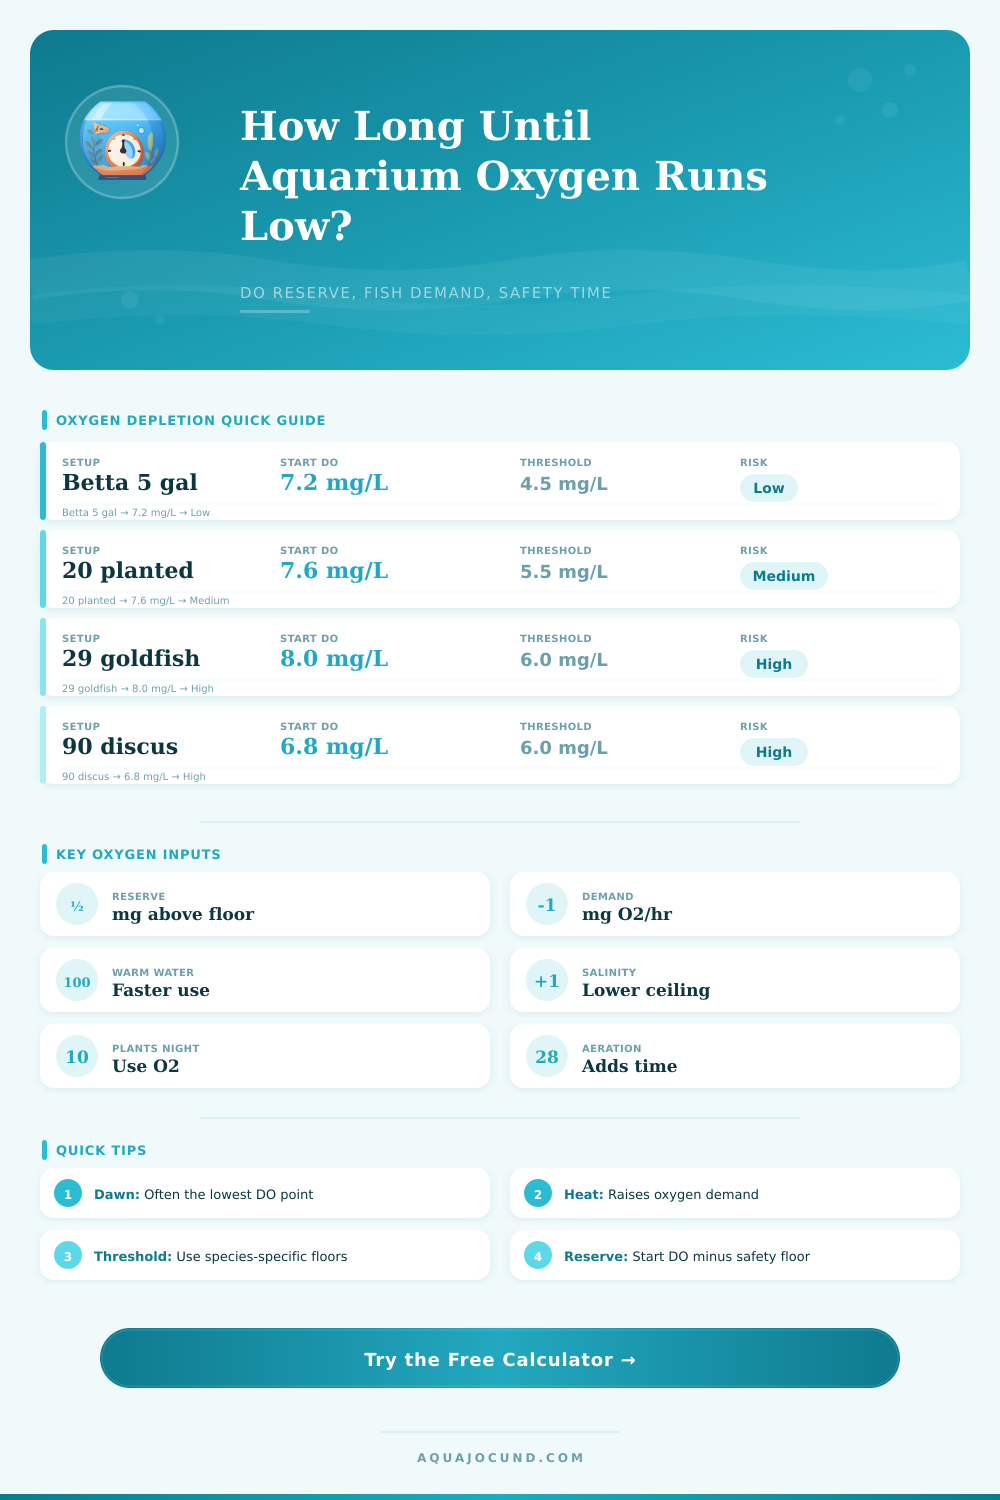
| 5 gal betta | 0.03-0.06 lb | 4.5-5.0 mg/L | Small demand, small water reserve |
| 20 long community | 0.20-0.40 lb | 5.5-6.0 mg/L | Good volume for moderate stock |
| 29 gal goldfish | 0.60-1.00 lb | 6.0-7.0 mg/L | High oxygen use per gallon |
| 55 gal mixed reef | 0.50-1.20 lb | 5.5-6.2 mg/L | Salinity lowers oxygen ceiling |
| 90 gal discus | 0.80-1.40 lb | 6.0-6.8 mg/L | Warm water shortens reserve |
On a steamy summer evening, you lose electricity. Your fish tank loses its air supply as well. The filter stop humming, and the water stops moving at the surface. You know your aquatic pet are not getting their oxygen supplied by machines anymore.
Each bacterium, each shrimp, each fish sucks up a limited amount of dissolved O2 from the tanks water. That is when it becomes realy important to know how long you will have until they start suffocating. Not one minute longer. But also not a single minute shorter. How quickly does this invisible buffer dissolve? When the calculator runs the math (as in the calculator at the top of this post), you’ll see some numbers. Understanding why they’re there makes a world of difference when prepping for an emergency.
How to Calculate Oxygen Left in Your Tank
Your first number might be easy to miss: it is your beginning dissolved oxygen reading minus your minimum safe level. How much can you go down and still keep fish alive? How much can you use up without running out? In other words, if you begin with eight milligrams per liter and need to maintain six or higher for sensitive livestock, then you’ve got just two units of O2 to play with… no matter how big that tank look. The ceiling (your starting DO) minus the floor (the lowest acceptable level) equals your available buffer; which is used as a foundation for calculating usage rates.
Many of us get tripped up over temperature’s double duty. Warmer water contains less dissolved oxygen, which instantly shrinks your starting cap. It also increases metabolic rates. As fish breathe harder they consume whatever is there. The page’s reference table show this nicely with a simultaneous rise in demand and drop in saturation. In other words, an 86 degree discus tank will experience a steeper decline than a sixty eight degree goldfish bowl, both with equal biomasses. Because it compounds, little changes like a brief overnight spike in summer can cut your safety window in half without notice.
Another common error occurs with biomass. Most people just guesstimate how much their fish weigh by counting them or measuring their length. Respiration classes categorise fish by their metabolic demand, ranging from active cichlids to lazy labyrinth fish. In fact, people often struggle with guessing actual mass, so instead, the tool uses respiration class to estimate metabolic demand. Choosing the incorrect respiration class will make a big difference in output. For instance, if you pick a low metabolism group but have a bunch of territorial swimmers in the tank, the calculator will falsely reassure you that your run time will be longer than it actualy is.
To plan for power outages, it’s advisable to err on the side of a little too much biomass. That buffer could of been blamed on those hidden oxygen thieves found in your substrate and filter media. However, when we add replacement to the equation in the form of aeration (e.g., a battery-powered air stone), things change completely. Such a device doesn’t suddenly fill your tank with more oxygen; rather, it exchanges some of that gas at the surface and significantly slows down the draining process. Accordingly, the model assigns an exchange factor that accounts for this credit. Surface agitation, even as small as a ripple; prevents stagnation layers from forming on top of water and thus is useful. If you’re transporting/shipping your tanks and there’s little-to-no agitation, then each fraction of an hour counts for animal welfare purposes.
“Relying on gut feel isn’t good either. You can’t see oxygen with your eyeballs. If you’re seeing fish hanging at the surface, they’re usually already in distress. Then it’s too late and you’ve depleted their reserves.”
Preparing prevents desperation. Knowing your system’s capacity will help determine if upgrading to a backup battery is an expense worth making or not, or if scaling back feedings prior to the heat would be wise. Little tweaks like these provide time should your primary rig fail. Dissolved oxygen management is all about the hidden rules of your aquarium. You let those numbers make your decisions, but you observe them to confirm that they are valid. Calibrate your meters and manage your expectations. Do you want to guess when the lights will come back on in the morning or do you want to know for certain? Knowing is the difference between a disaster and an inconvenient situation.