Aquarium Nitrate Dilution Rate Calculator
Estimate how fast nitrate falls or rebounds from water change percent, frequency, source nitrate, daily nitrate production, and plant or export removal.
🧪Nitrate Routine Presets
⚖Nitrate And Water Change Inputs
Use true water volume after substrate, rock, decor, sump level, and equipment displacement.
Enter tap, well, RO mix, or new saltwater nitrate after mixing.
Estimate from feeding, stocking, detritus, and measured rise between changes.
Percent of daily nitrate production removed by plants, refugium, denitration, or media.
📊Calculated Routine Benchmarks
🌱Export Method Comparison Grid
No Active Export
Water changes carry nearly all nitrate removal in the schedule.
Typical offset: 0%Light Plants
Slow growth trims a small part of daily production when nutrients and light are balanced.
Typical offset: 5-20%Dense Plants
Fast stems, strong roots, and regular trimming can make weekly nitrate rise much smaller.
Typical offset: 20-45%Floating Plants
Duckweed, frogbit, salvinia, and water lettuce remove nitrate only when harvested.
Typical offset: 25-60%Refugium Or Scrubber
Macroalgae or turf export works best with strong light, flow, and actual harvest.
Typical offset: 20-50%Deep Media
Denitration can lower nitrate slowly, but performance varies with flow and organics.
Typical offset: 10-35%Nitrate Resin
Chemical media can help temporarily, then drops off as capacity is exhausted.
Typical offset: 15-40%Custom Estimate
Use measured nitrate rise before and after adding the export method.
Enter your own %📋Nitrate Range Reference
| System Type | Common Target | Watch Level | Dilution Note |
|---|---|---|---|
| Shrimp or delicate planted nano | 5-20 ppm | 30+ ppm | Use smaller, steadier changes |
| General freshwater community | 10-30 ppm | 40+ ppm | Weekly changes usually fit |
| Goldfish or heavy feeders | 20-40 ppm | 60+ ppm | Large or frequent changes needed |
| African cichlid display | 10-40 ppm | 60+ ppm | Source nitrate matters with hard tap water |
| Reef fish with corals | 2-15 ppm | 25+ ppm | Balance dilution with phosphate and export |
| Fish-only marine | 10-40 ppm | 80+ ppm | Large volume changes can be effective |
💧Common Tank Water Change Volumes
| Tank Size | 20% Change | 30% Change | 50% Change | Use Case |
|---|---|---|---|---|
| 10 gal / 38 L | 2 gal / 8 L | 3 gal / 11 L | 5 gal / 19 L | Nano or quarantine |
| 20 gal / 76 L | 4 gal / 15 L | 6 gal / 23 L | 10 gal / 38 L | Planted community |
| 29 gal / 110 L | 5.8 gal / 22 L | 8.7 gal / 33 L | 14.5 gal / 55 L | Community display |
| 40 gal / 151 L | 8 gal / 30 L | 12 gal / 45 L | 20 gal / 76 L | Breeder tank |
| 55 gal / 208 L | 11 gal / 42 L | 16.5 gal / 62 L | 27.5 gal / 104 L | Goldfish or cichlids |
| 75 gal / 284 L | 15 gal / 57 L | 22.5 gal / 85 L | 37.5 gal / 142 L | Large display |
| 125 gal / 473 L | 25 gal / 95 L | 37.5 gal / 142 L | 62.5 gal / 237 L | Large fish load |
⏱Schedule Effect Examples
| Routine | Same Weekly Volume? | Stability | Best Fit | Main Tradeoff |
|---|---|---|---|---|
| 20% every 7 days | 20% weekly | Moderate swing | Light to average stocking | May drift high with heavy feeding |
| 30% every 7 days | 30% weekly | Good reset | Most community tanks | Source nitrate can set a high floor |
| 25% every 3.5 days | 50% weekly | Smoother than one 50% | Sensitive livestock | More maintenance sessions |
| 50% every 7 days | 50% weekly | Strong dilution | Goldfish, grow-outs, high nitrate | Match temperature and chemistry |
| 15% every 2 days | 52.5% weekly | Very smooth | Automated water change | Needs reliable dosing and drain setup |
🔧Export Profile Reference
| Profile | Typical Export Factor | How To Confirm | Calculator Caution |
|---|---|---|---|
| No active export | 0% | Nitrate rise equals production estimate | Water changes dominate |
| Light live plants | 5-20% | Slow but measurable lower weekly rise | Low light limits uptake |
| Dense planted tank | 20-45% | Trimmings leave the tank weekly | Deficiencies reduce export |
| Floating plant harvest | 25-60% | Harvested biomass increases | Cover can shade submerged plants |
| Refugium or algae scrubber | 20-50% | Algae harvested regularly | Performance follows light and flow |
| Denitrator or deep media | 10-35% | Effluent tests lower than display | Changes slowly after adjustments |
| Nitrate resin or media | 15-40% | Trend flattens until media exhausts | Do not assume permanent capacity |
In an hour, you’re checking your test kit several more times and the nitrate reading inches closer to forty parts per million. You drain thirty percent of the tank and, within another week or two, numbers is creeping upward again. Why is that so frustrating? People do not understand dilution in a closed loop.
It isn’t just a case of pulling out undesirable water; it’s also a matter of controlling what goes into that water while waiting until your next round of maintenance. Most hobbyists attempt to perform mass balance calculations in their head, a practice that never goes well.
How to Control Nitrate Levels
This page has a handy tool. It forces you to consider your actual tank volume, the nitrate spike you’re currently experiencing, your target nitrate, and what you are starting with, such as tap or RO water. RO water? what’s the nitrate content?). Most fail to remember that you bring along the chemical makeup of new water. No amount of changing every week is going to get you from twenty parts per million if that’s your tap water starting point. Before shelling out for a load of filtration media, use the calculator to see where you are hitting that hard floor and readjust your expectations to match.
Secondly, consider amount of waste produced each day, which is generally more then we estimate. Unless you have very few fish or understocked your tank, and unless you feed only what they consume, there’s a steady flow of flake food, excess food, and/or waste from goldfish that gets converted to nitrate even if you vacuum substrate regularly. This constant buildup fights against your regular water changes.
The calculator has a refugium/plants removal factor (because live plant growth will absorbs nitrates as it grows). But only the harvested biomass actualy exits the system. So if you cut away some duckweeds growing on the surface and throw them into the trash instead of letting them rot back into the tank, you’re exporting nitrogen. Leaving them to rot simply recycles that nitrogen right back in the water.
The percentage isn’t as important as when it’s changed. If I go through 50% of my water in one week and then don’t change it for another two weeks, I’ll create a sawtooth pattern where nitrates spike to dangerous highs and then plummet suddenely back down again. That’s more stressful to your sensitive livestock than maintaining constant but ever-so-slightly elevated levels. Breaking up that total volume into smaller, more frequent changes will dramatically flatten that curve. It will also minimize pH or temperature-related shocks (less foreign water being introduced all at once).
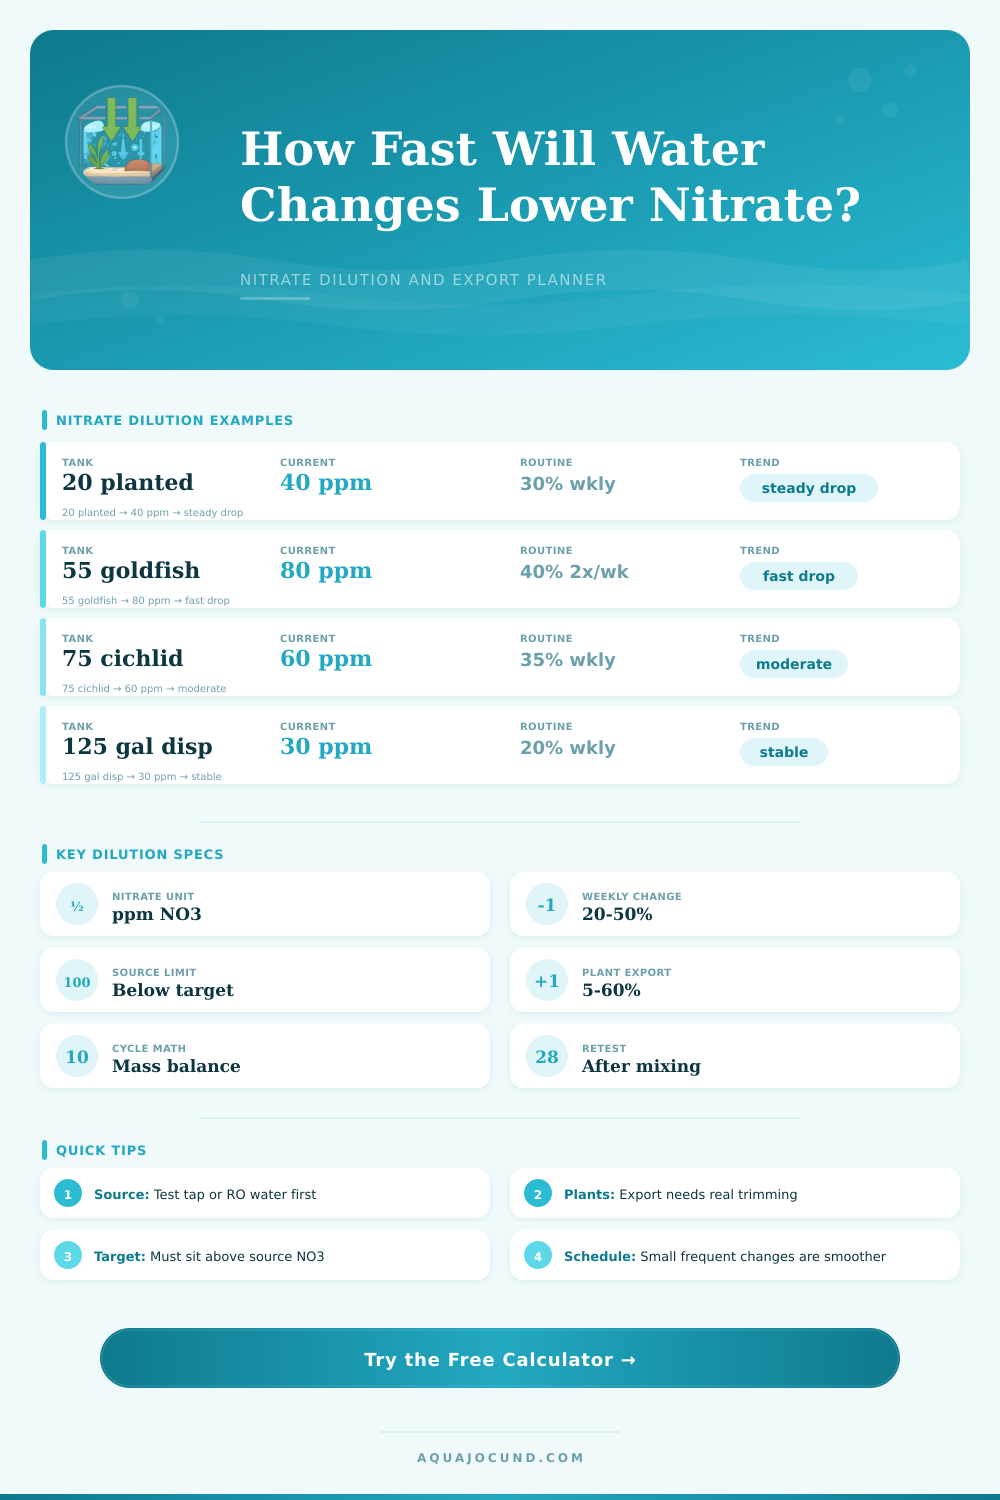
The table provided with the tool shows how different schedules affect stability in many types of tanks, from large cichlid displays to shrimp nanos. It’s hard to guess how much waste your fish produce without knowing the facts. A simple way to calculate it would be to not change your water for a week and then measure the increase. Let’s say the nitrate increased from ten ppm to twenty ppm over a week’s time. That means your tank was producing about one and a half parts per million per day of nitrate prior to being removed by plant. Plug that into the field called “daily production” above and see how your proposed routine will handle that workload. How close to a stable state does it predict the peak will get before another change? Is that workable with your existing plan, or do you have to up frequency or volume?
Sure, we can all get lured by “zero nitrates” and go chasing unicorns, but in most cases, you cannot maintain zero nitrate at any cost; especially if it means having to continuously replace some type of chemical media. Twenty to forty parts per million isn’t hard to manage and is reasonable for a community tank. That’s much easier to aim for and less stressful on your biological filter. Consistency is key. Don’t be too hard on yourself or expect perfection.
When you learn about the interactions between removal efficiency, amount of waste produced every day, and your source water quality, you’ll stop guessing and begin to manage. Nitrate becomes a matter of math instead of an ongoing crisis you deal with each month. Seeing how those factors play off one another takes away the fear. Instead of constantly battling against the tank, you work with the chemistry. You can enjoy your tank without it feeling like a chore, because you shouldn’t of second guess everything anymore. Everybody stays healthy.