Aquarium Refill Volume After Evaporation Calculator
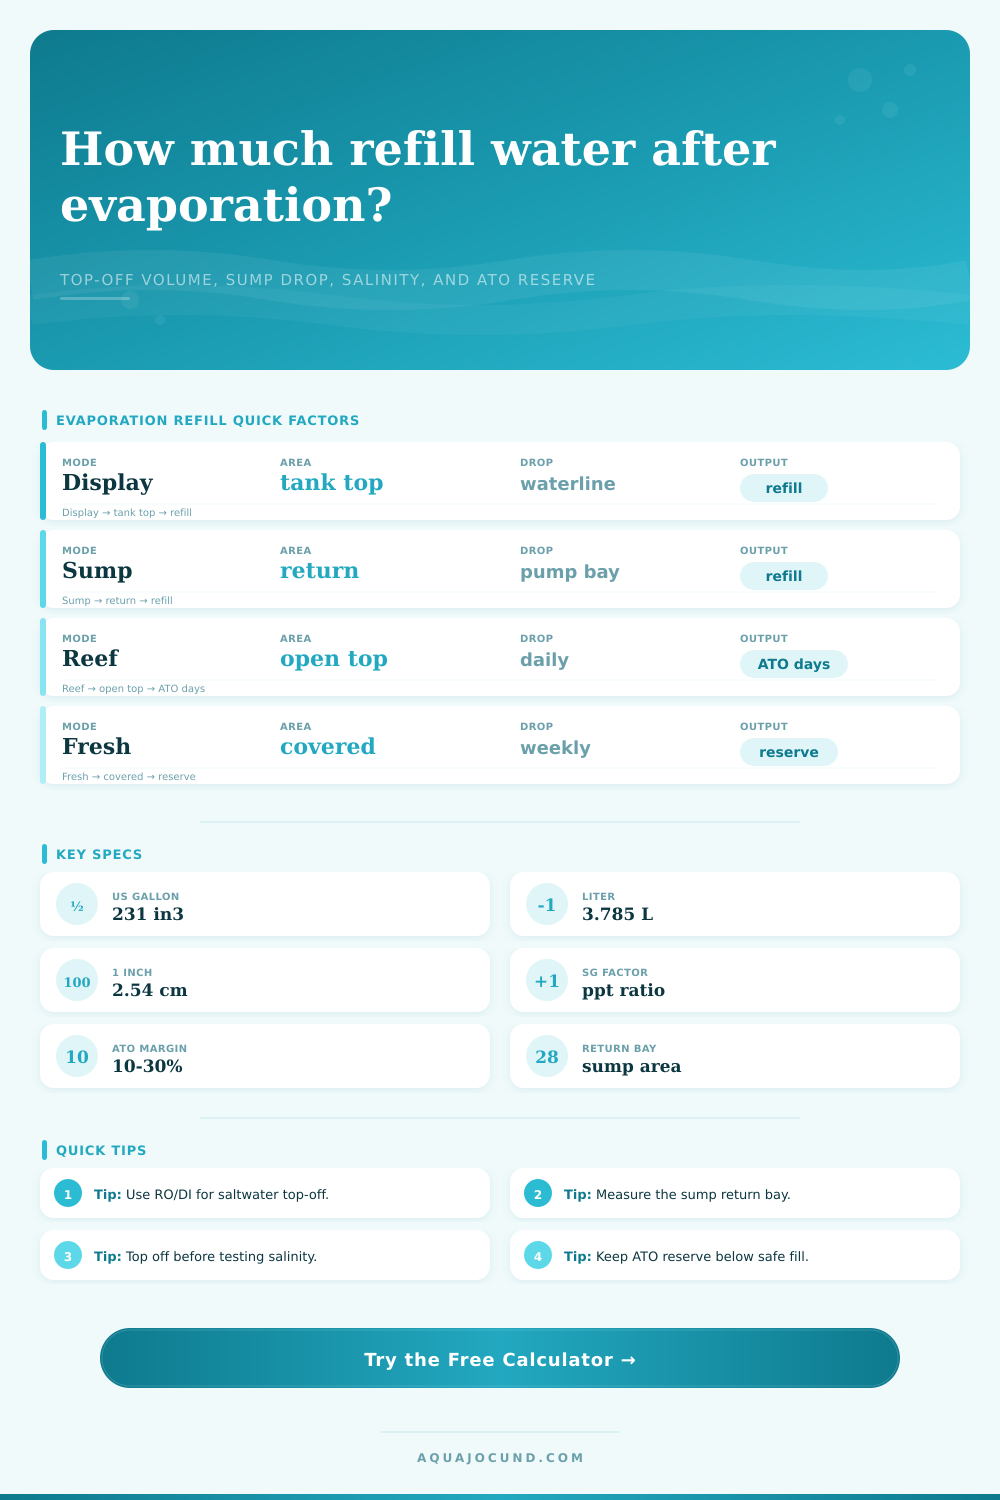
Estimate RO/DI or freshwater top-off from water height drop, surface area, sump return section drop, salinity concentration, and ATO reserve days.
📌Evaporation Presets
⚙Refill Inputs
Calculation Breakdown
📊Evaporation Profile Grid
🗂Measurement Mode Comparison
📘Refill Formula Table
| Calculation step | Formula | Imperial factor | Metric factor |
|---|---|---|---|
| Display evaporation | surface area × height drop | in² × in / 231 = gal | cm² × cm / 1000 = L |
| Sump return evaporation | return section area × return drop | in² × in / 231 = gal | cm² × cm / 1000 = L |
| Daily top-off | refill volume / elapsed days | gal per day | L per day |
| Reservoir capacity | safe fill volume / daily loss | usable gal / gal per day | usable L / L per day |
| Salinity estimate | target salinity × system volume / remaining water | ppt ratio | ppt ratio |
📏Common Tank Refill Reference
| Tank size | Typical surface | 0.25 in drop | 0.5 in drop |
|---|---|---|---|
| 5.5 gal nano | 16 x 8 in / 41 x 20 cm | 0.14 gal / 0.5 L | 0.28 gal / 1.0 L |
| 10 gal standard | 20 x 10 in / 51 x 25 cm | 0.22 gal / 0.8 L | 0.43 gal / 1.6 L |
| 20 long | 30 x 12 in / 76 x 30 cm | 0.39 gal / 1.5 L | 0.78 gal / 3.0 L |
| 40 breeder | 36 x 18 in / 91 x 46 cm | 0.70 gal / 2.7 L | 1.40 gal / 5.3 L |
| 75 gal display | 48 x 18 in / 122 x 46 cm | 0.94 gal / 3.5 L | 1.87 gal / 7.1 L |
| 125 gal display | 72 x 18 in / 183 x 46 cm | 1.40 gal / 5.3 L | 2.81 gal / 10.6 L |
🧪Salinity Concentration Table
| Water loss from saltwater system | 35 ppt becomes | SG approx | Refill note |
|---|---|---|---|
| 1% evaporation | 35.4 ppt | about 1.0267 | Small but measurable in nano reefs |
| 3% evaporation | 36.1 ppt | about 1.0272 | Top off before adjusting salt mix |
| 5% evaporation | 36.8 ppt | about 1.0277 | Common after a missed ATO refill |
| 8% evaporation | 38.0 ppt | about 1.0286 | Correct gradually if livestock are stressed |
| 10% evaporation | 38.9 ppt | about 1.0292 | Check reservoir, sensors, and pump limits |
🔌ATO Reserve Planning Table
| Daily evaporation | 3-day reserve | 7-day reserve | 10-day reserve |
|---|---|---|---|
| 0.25 gal / 0.9 L | 0.8 gal / 2.8 L | 1.8 gal / 6.6 L | 2.5 gal / 9.5 L |
| 0.50 gal / 1.9 L | 1.5 gal / 5.7 L | 3.5 gal / 13.2 L | 5.0 gal / 18.9 L |
| 1.00 gal / 3.8 L | 3.0 gal / 11.4 L | 7.0 gal / 26.5 L | 10.0 gal / 37.9 L |
| 1.50 gal / 5.7 L | 4.5 gal / 17.0 L | 10.5 gal / 39.7 L | 15.0 gal / 56.8 L |
| 2.50 gal / 9.5 L | 7.5 gal / 28.4 L | 17.5 gal / 66.2 L | 25.0 gal / 94.6 L |
💡Practical Tips
That’s usually difficult to spot at first but then the water line drops. You might notice it when substrate becomes more visible or sump skimmer starts pulling in air. Day after day the water level gets lower. Eventually, salt levels rise and your livestock suffers.
A lot of aquarists sees the specific gravity rising and wonder what happened to their tank. Measure how far the water drop and its surface area. Do the math and it will tell you exactly how much volume has been lost.
How to Manage Water Evaporation
So know what’s leaving the system. When setting up a display, only include everything that is exposed as part of your open water. If you have a sump on a reef tank, the water level in the display rarely changes; it just goes down into return pump chamber. That make a difference in calculating the loss. Measure the width and length of the return section, NOT the main display tank. Selecting the right mode allow the calculator to perform the necessary math so you’re measuring the right amount. That’s where many people go astray, they measure the large tank and don’t understand why their top-off amounts doesn’t reflect what they see.
Once you know the volume, you need to think about daily rate. The volume doesn’t evaporate at a constant rate. That varies based off air movement, room temperature, and relative humidity. A covered freshwater tank might lose a fraction of an inch a day. A well-plumbed reef tank with lots of flow, near a ceiling fan, could easily be twice as fast (or more). It understand those evaporation profiles. It knows the effect of high humidity vs. Low humidity (a tropical room versus a dry winter house). It help you plan for your future needs.
You can say, “I’ll top off tomorrow,” instead of “Oh no! I’m down X!” This turns a chore from something you react to into something you plan for.
The effects of lackluster monitoring show themselves in salt levels. Salt doesn’t leave. Fresh water leaves. Each time you lose a drop, what’s left behind gets more concentrated. A 5 percent reduction isn’t much, is it? If so, why do the reference tables (on this page) demonstrate a rapid increase? Answer: Because 5 percent raises salinity from a comfortable 35 parts per thousand to almost 37. That’s when your corals will appear okay but they’re under stress. And that stress compound over time. You want to top off before the salinity shift enough to trip a biological alarm.
Use RO/DI water (nothing less). Never add saltwater to compensate for losses due to evaporation. That just hastens the issue.
If you’re looking to automate things, then an Automatic Top-Off (ATO) system is a life saver. However, a good one is only as good as its size. The calculator features a reserve planner that can shows you how long your reservoir will last. Simply enter your ATO container’s capacity and your tank’s net water volume. The results will tell you whether your existing setup could of withstand a 7-day vacation or if you require a bigger bottle. It would be smart to plan with some margin of safety. For example, if your stand loses two gallons per day, make sure your reservoir contains at least enough to sustain your travels for longer than that.
This tool will calculate how many days your set-up can go without refilling by taking into account the amount of water lost each day. It includes a safety buffer so you don’t wake up to an empty sump.
To keep a tank stable, you need consistency. One evaporated drop at a time, you’re fighting disorder. If you pick the correct profile for your tank and measure the drop accurately, you eliminate the guessing game. The tool gives you the numbers; you supply the observation. Note the water line. Measure the drop. Fill ‘er up. It is a routine that becomes second nature. This routine keeps your livestock healthy and your ecosystem balanced.
Water line drops, but your stress level doesn’t have to.