Conductivity to TDS Converter
Convert aquarium, pond, tap, and RO water conductivity into TDS on the 0.5, 0.64, and 0.7 scales, with salinity context for brackish and marine readings.
📌Quick presets
⚙Converter inputs
🧪Live scale comparison
📊Meter scale reference
🔁EC to TDS conversion table
| Conductivity | 0.5 scale | 0.64 scale | 0.7 scale |
|---|---|---|---|
| 10 uS/cm | 5 ppm | 6 ppm | 7 ppm |
| 50 uS/cm | 25 ppm | 32 ppm | 35 ppm |
| 100 uS/cm | 50 ppm | 64 ppm | 70 ppm |
| 250 uS/cm | 125 ppm | 160 ppm | 175 ppm |
| 500 uS/cm | 250 ppm | 320 ppm | 350 ppm |
| 1000 uS/cm | 500 ppm | 640 ppm | 700 ppm |
| 5000 uS/cm | 2500 ppm | 3200 ppm | 3500 ppm |
📘Aquarium and RO water context
| Water context | Typical EC | Approx TDS | Use note |
|---|---|---|---|
| RO DI product | 0-20 uS/cm | 0-10 ppm | Top-off and mixing base |
| RO membrane product | 5-80 uS/cm | 3-40 ppm | Depends on source water and membrane age |
| Soft planted aquarium | 80-300 uS/cm | 40-210 ppm | Often matched to plant and fish needs |
| Shrimp remineralized water | 150-350 uS/cm | 75-245 ppm | Species and GH/KH salt matter |
| Community tap water | 200-800 uS/cm | 100-560 ppm | Stable readings matter more than exact ppm scale |
| Hard cichlid aquarium | 500-1500 uS/cm | 250-1050 ppm | Mineral-rich water for hardwater species |
| Low brackish aquarium | 3000-15000 uS/cm | 1.5-10.5 ppt | Use salinity tools as salinity rises |
| Marine aquarium | 45000-55000 uS/cm | 30-38 ppt | Use refractometer or conductivity salinity mode |
🐟Preset scenario reference
| Scenario | EC reading | Primary factor | Target check |
|---|---|---|---|
| RO DI product water | 4 uS/cm | 0.5 | Near zero TDS |
| Fresh RO membrane | 18 uS/cm | 0.5 | RO rejection check |
| Soft planted tank | 180 uS/cm | 0.64 | Soft freshwater band |
| Shrimp remineralized | 260 uS/cm | 0.5 | Mineral salt target |
| Community tap water | 520 uS/cm | 0.7 | Tap stability check |
| Hard cichlid water | 1150 uS/cm | 0.7 | Hardwater context |
| Koi pond check | 650 uS/cm | 0.64 | Pond mineral trend |
| Low brackish tank | 6000 uS/cm | 0.64 | Salinity cross-check |
📝Salinity interpretation table
| Approx salinity | Conductivity context | Common label | Best instrument |
|---|---|---|---|
| 0-0.5 ppt | 0-800 uS/cm | Freshwater | EC or TDS meter |
| 0.5-5 ppt | 800-8000 uS/cm | Light brackish | EC plus salinity meter |
| 5-18 ppt | 8000-28000 uS/cm | Brackish | Conductivity salinity mode |
| 30-38 ppt | 45000-55000 uS/cm | Marine | Refractometer or salinity probe |
But now you’re probably looking at your meter, which displays a number, thinking: “Okay… I have water in my tank. But is it realy clean? Or is it simply clear?”
Clear is not the same as conductive. What does this mean? It means one measures visibility (clarity) and the other measure the unseen, dissolved substances. This is a key distinction in water chemistry that confuses many people in the hobby.
Understanding Water Meters and Readings
Those meters we use for measuring this stuff (TDS or total dissolved solids) generally work by measuring conductivity, i.e., how well electricity flows through something. Water isn’t a great conductor. However, when it has ions, salts, and minerals suspended in it, water conduct better. These meters measure conductivity to estimate how much material is dissolved in the water.
And here’s the rub, there’s a lot of guessing going on with those readings. Here’s where we run into trouble, because converting to ppm isn’t some unchangeable law of physics. It’s an estimation with several assumptions (namely, what kinds of ions is in the water). A milliliter of magnesium sulfate doesn’t behave the same way as a milliliter of calcium carbonate or a milliliter of salt. And since your aquarium contains a complex combination of dissolved mineral compounds, it’s going to depend on your water source and how closely each one correspond to electrical conductance and total mass.
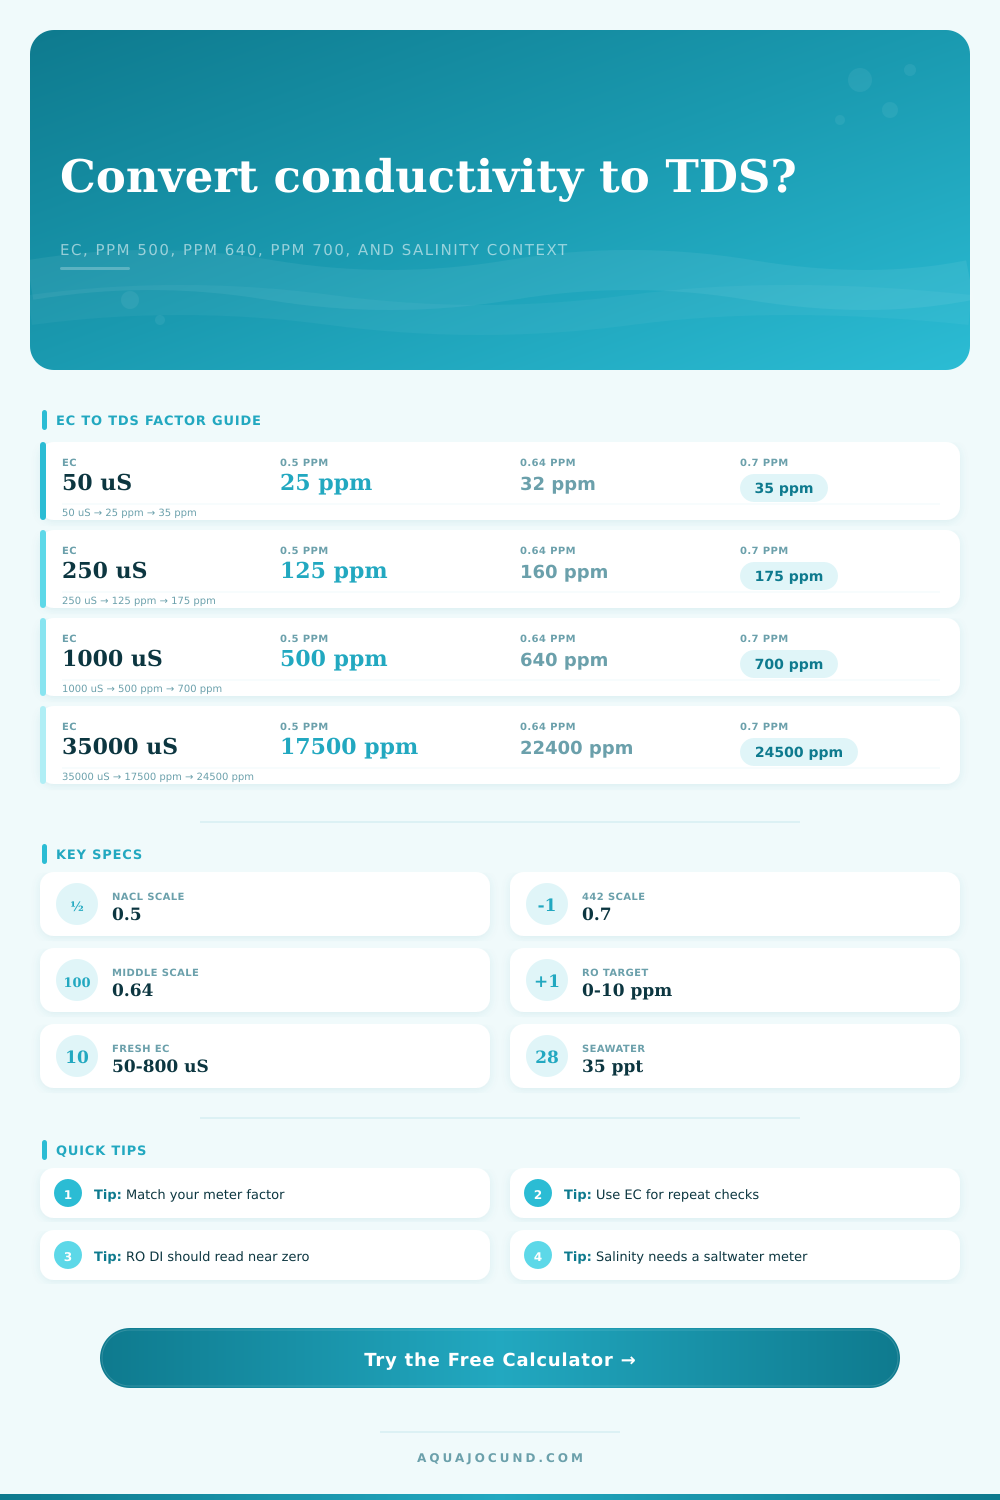
That’s why you’ll find a variety of ppm-to-conductivity scales in the hobby, including 0.5, 0.64, and 0.7 being most common. These values corresponds to the scale factor for converting conductivity readings. Applying incorrect value is akin to measuring distance in miles when the map is in kilometers. You may see something close on paper, but the numbers won’t make sense.
5 (on a sodium chloride scale (i).e., fairly accurate for basic saltwater solutions; not too bad for tap water, though it under-reports hardness).
0.7, usually tied to the 442 standard (which tends to over-report TDS for most soft freshwater situations)
64 is a middle-of-the-road option that’s pretty practical for most community tank.
The calculator above does all the unit conversion for you. You won’t have to do all those mental gymnastics trying to figure out how to convert between units in your head. All you really need to know is what scale your meter is calibrated for. Look for sticker on your meter, read the manual if necessary.
More importantly, just use the same scale every week. Consistency trumps accuracy when it comes to this. If you record your water parameters every week, it will be easier to see trends if you stick with the same scale. The direction of change is far more significant than the actual number. That’s it.
Another wrinkle: The warmer the water is, the greater its ion mobility. Warm water gives less resistance to an electrical current then cool water. A reading in the summer, then, will be higher than one taken in the winter if you don’t use a meter that automatically adjusts for water temperature.
With this tool, though, you can adjust for the difference by entering the temperature of the sample and adjusting all your results to a base temperature of 25 degrees Celsius. That’s important when trying to compare results from various parts of the house, or from various seasons. Otherwise, a cold day may lead you to believe your RO membrane is failing.
Conductivity- For those running reverse osmosis systems, the goal is near-zero conductivity. TDS readings on good product water should be in the single digits. Typically if your conductivity is starting to creep up, then either your seals has started failing or your membrane has become clogged. To calculate the rejection rate, you compare the conductivity of the source water vs the product water and get a percent reading which represents how well the system rejects contaminants. That is a great way to know when to change membranes or other filters before your fish suffer.
Salinity measurement diverges entirely from TDS estimation. If you enter brackish or marine waters, the conductivity range is large enough that ppm conversion is meaningless and even potentially misleading. You’re no longer simply estimating dissolved minerals, but instead measuring the density of salt itself. For this reason, salinity-specific probes and refractometers becomes necessary. Seawater has a dominant ion mix made up primarily of sodium and chloride ions at a specific ratio. Attempting to measure saltwater with a freshwater TDS meter is akin to weighing a rock with a ruler. It’s the wrong tool for the job.
Conductivity doesn’t tell you what’s in your water; it’s a proxy for water quality. Conductivity tells you how much there is of something (mineral load), but it won’t tell you exactly what “it” is. Phosphates, nitrates, heavy metals… They’ll all register as higher conductivity.
What this means is that while conductivity isn’t useless, it relies heavily on the context of both your water source and the history of your tank. Is the number increasing or decreasing? Are your fish doing well? If the number is stable, then don’t stress too much about the exact ppm. The trend will help you know when to investigate further. Use the tool and understand its limitations. Let the numbers speak.
Clear water is only the beginning; clean water is the end.