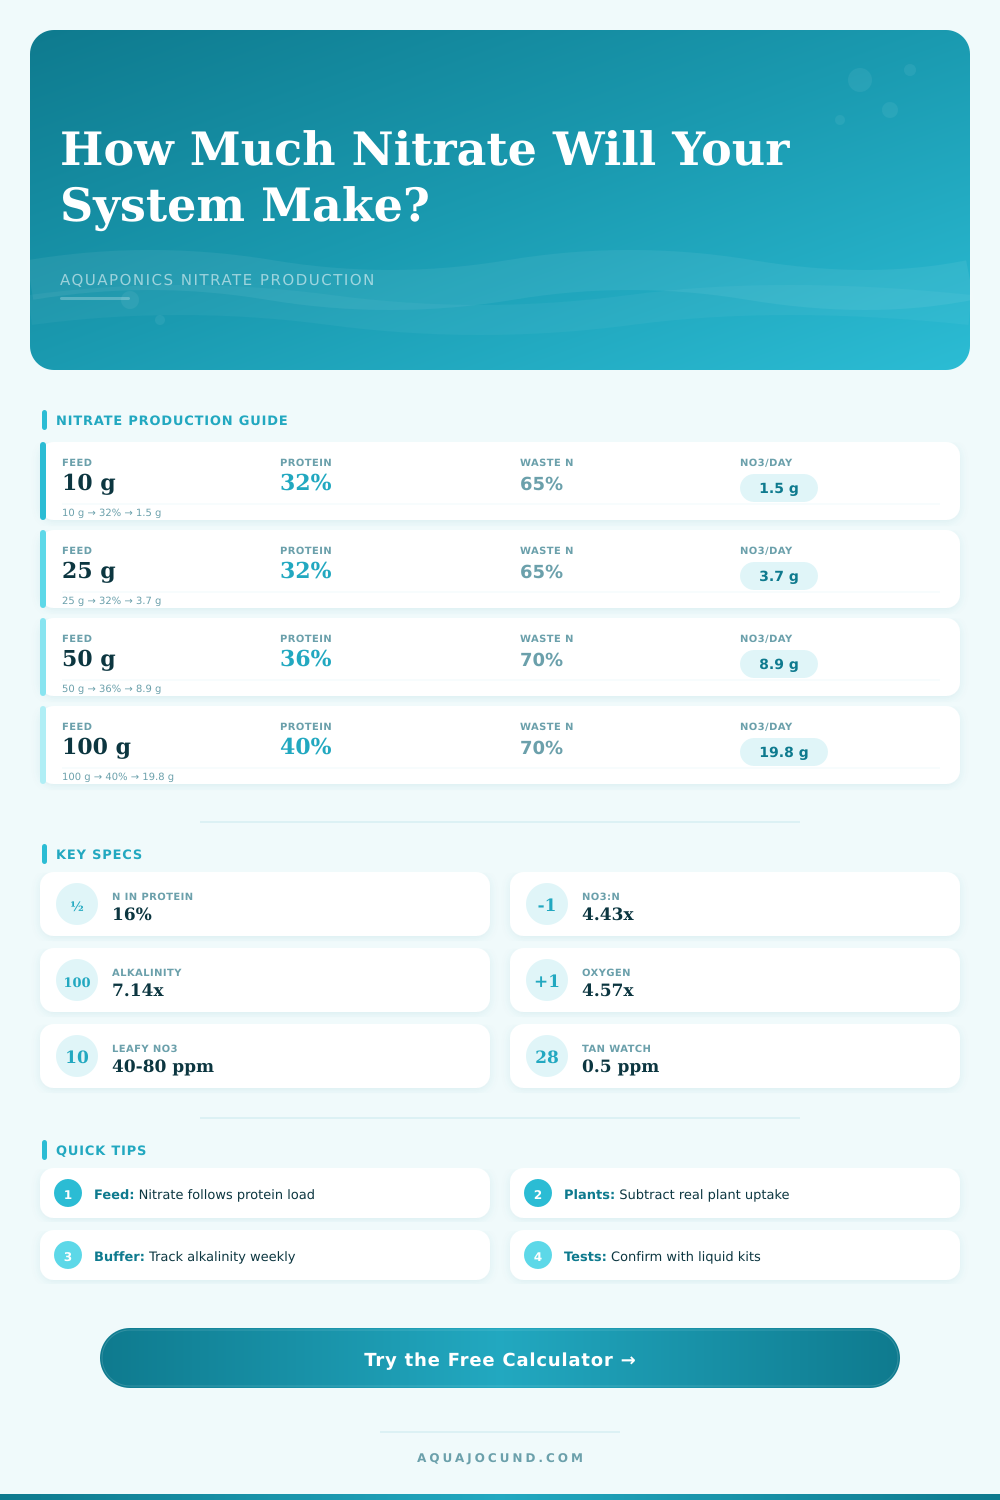
🧪 Aquaponics Nitrate Production Calculator
Estimate nitrate generation from fish feed, protein level, biofilter conversion, plant uptake, tank volume, and water exchange.
| Scenario | Daily Feed | Protein | Waste N | NO3 Made | Use Note |
|---|---|---|---|---|---|
| Seedling herb raft | 5 g/day | 30% | 55% | 0.6 g/day | Usually plant-limited |
| 20 gal lettuce | 10 g/day | 32% | 65% | 1.5 g/day | Watch small-water swings |
| 29 gal media bed | 18 g/day | 32% | 65% | 2.7 g/day | Good home balance |
| 40 breeder greens | 30 g/day | 34% | 65% | 4.7 g/day | Needs steady uptake |
| 55 gal mixed bed | 50 g/day | 32% | 70% | 7.9 g/day | Remove solids well |
| 75 gal tomatoes | 80 g/day | 36% | 70% | 14.3 g/day | Heavy fruiting demand |
| 125 gal raft | 120 g/day | 32% | 65% | 17.7 g/day | Large plant canopy |
| IBC catfish loop | 200 g/day | 35% | 70% | 34.7 g/day | Biofilter critical |
| Fish / Feed Type | Typical Protein | Usual Feeding Rate | Likely Waste N | Nitrate Planning Note |
|---|---|---|---|---|
| Adult tilapia grow-out | 28-36% | 1-2% body weight/day | 60-70% | Reliable warm-water nitrate source |
| Juvenile tilapia | 36-42% | 3-5% body weight/day | 60-75% | Nitrate can rise quickly |
| Channel catfish | 28-35% | 1-2% body weight/day | 60-70% | Often paired with media beds |
| Trout / salmonid feed | 40-48% | 1-2% body weight/day | 55-70% | High protein and oxygen demand |
| Koi maintenance feed | 28-35% | 0.5-1.5% body weight/day | 60-75% | Seasonal feeding changes output |
| Goldfish classroom tank | 30-36% | 0.5-1.5% body weight/day | 60-75% | Low feed but small volume |
| Crop / System State | NO3 Range | Reading Status | Plant Response | Action |
|---|---|---|---|---|
| Cycling with fish | 0-20 ppm | Transition | Plants may be pale | Keep TAN and nitrite safe |
| Seedlings / cuttings | 10-40 ppm | Light | Gentle nutrient level | Avoid overfeeding |
| Leafy greens | 40-80 ppm | Target | Strong vegetative growth | Maintain steady feed |
| Herbs and basil | 40-100 ppm | Target | Good color and shoots | Harvest to keep uptake high |
| Fruiting crops | 60-120 ppm | Demanding | Needs broader nutrients | Balance potassium and iron |
| Fish-heavy system | 120+ ppm | High | Nitrate accumulating | Add plants or exchange water |
| Biofilter State | Use in Calculator | Expected Test Pattern | Risk Level | Best Adjustment |
|---|---|---|---|---|
| New, not cycled | 0-30% | Ammonia appears first | High | Do not chase nitrate yet |
| Nitrite phase | 30-60% | Nitrite lingers | High | Reduce feeding |
| Young cycled filter | 60-80% | Low TAN, some nitrite | Watch | Increase feed slowly |
| Mature media bed | 80-95% | TAN and nitrite near zero | Stable | Use nitrate trend |
| Mature moving bed | 90-98% | Fast TAN conversion | Stable | Check alkalinity |
| Cold or low pH filter | 40-75% | Conversion slows | Watch | Warm or buffer water |
| System Size | Water Volume | 10 g NO3 Adds | 50 g NO3 Adds | Planning Note |
|---|---|---|---|---|
| Small aquarium loop | 10 gal / 38 L | 264 ppm | 1321 ppm | Tiny systems swing fast |
| 20 long aquaponics | 20 gal / 76 L | 132 ppm | 660 ppm | Test after feed changes |
| 40 breeder bed | 40 gal / 151 L | 66 ppm | 330 ppm | Good classroom size |
| 55 gal mixed system | 55 gal / 208 L | 48 ppm | 240 ppm | Moderate buffering |
| 125 gal raft | 125 gal / 473 L | 21 ppm | 106 ppm | More stable trends |
| IBC tote system | 275 gal / 1041 L | 10 ppm | 48 ppm | Weekly trends matter |
Compare the net weekly rise to your nitrate kit: if the kit climbs faster than the calculator, plants are taking up less nitrate than expected or solids are mineralizing later in the loop.
Do not ignore alkalinity demand: every gram of TAN-N nitrified consumes carbonate buffer. Falling KH and pH can slow nitrification before nitrate production catches up.
You fill the tank with fish, hoping that those nutrients will flow freely from their mouths into yours. Then you get water test results… nothing. Zilch. Nada. What’s wrong? Well, it happens to the best of us at some point. You fall in love with the new tank. But then you find out that fish poop doesn’t instantly translate to plant food. There’s something that needs to happen in-between (something rather strict and unforgiving).
And that’s where this calculator come in. After you enter your tank size and how much food you’re feeding, the calculator do all the math for you. No need to wonder about conversions or coefficients. It is one less black box.
How the Aquaponics Calculator Helps You
Nitrogen is king. In aquaponics, there are three main parts. First, there is nitrogen in form of ammonia from the fish. Next, nitrifying bacteria converts that ammonia into nitrite, and then into nitrate. Finally, there are plants, which adore nitrate.
But bacteria don’t automatically convert immediately. It depends on how much food they’re fed, what their environment is like, and if it gets hot. Is the pH getting odd, and are they even alive? People mess up here. When the system doesn’t “work,” they assume it’s because of the fish…or the plants. Actualy, the problem is often with the invisible microorganisms in the biofilter.
This tool takes that into account by letting you change the nitrification efficiency percentage. With a full-grown bed, it may reach 90% efficiency, while a struggling system might be limping along at 50%. Don’t lie to yourself: set the percent according to where your system realistically is, not where you wish it were.
The real lever you control is Feed. The more feed you give, the more waste. Waste produces more potential nitrate. But it can also produce more ammonia. This table from the same page show the impact of different protein levels and fish species on output. As you see, tilapia are prolific waste producers. They’re great for nutrient heavy systems. But also require more robust filtration than other fish. Protein-rich trout feeds spikes the nitrogen load even further.
If your plants aren’t around to absorb the excess, then simply assuming that more feed will remedy a nutrient deficit won’t work. Nitrate builds up. It doesn’t go away. It simply remains in the water and turns it into a salt bath that stunts root growth and stresses the fish.
That’s why this plant uptake question is important. How many nitrates are the plants extracting from the water? Leafy vegetables, for example, are good at stripping nitrate out of the water. Almost as quickly as the nitrate is created, the leafy green removes it from the water. Fruiting vegetables like tomatoes are a different beast altogether. They require more nitrogen initially (during the vegetative growth phase), but then change their demands once they start concentrating on fruiting and flowers. A high fruiting crop may result in an increase in the nitrate levels because they’re not removing it as aggressively than lettuce, for instance.
You need to balance the amount of fish with amount of plants. A small number of plant in a big tank will never be able to remove nitrates from the water. It’s a matter of input/output.
Don’t skimp on alkalinity. Alkalinity buffers gets consumed by the bacteria every single time ammonia converts to nitrate. It’s stoichiometry. You can see it or not, but it happens regardless. If you let your alkalinity fall too far then your pH will crash and nitrification will either shut down completely or slow down significantly.
This calculator projects out how much alkalinity you’re using per day so that you know how much buffer capacity you have left. Small thing but it matters. Everything else builds on top of a stable pH.
Water changes act as a safety valve. Even a little water each day will flush out some of the nitrates if they’re getting too high. It’s a bit like admitting that your plants aren’t up to the workload. But it’s also a practical solution. It gets you time to cut back on feeding or add more grow beds.
Of course, the numbers in the tool are estimated. Real-world systems is messy. Filters can get clogged with solids. Bacteria may die off during power outages. Conversion rates can be stopped by temperature swings. But having a theoretical baseline helps you create a map. Then when reality doesn’t match your prediction, you’ll know exactly where to look.
The feed, check. The filter, check. The plants… Check.
That’s a cycle of adjustment and observation. Everything’s fine, the fish are still swimming, the bacteria are still at work, the greens is still growing. You just have to keep things flowing.