RO Waste To Product Ratio Calculator
Estimate RO product water, waste water, flush volume, total feed water, pressure and temperature correction, and recovery percentage.
💧Quick Aquarium RO Presets
⚙RO Ratio Inputs
Calculation Breakdown
📊Comparison Grid
📘RO Ratio Reference Table
| Observed Ratio | Product Share | Typical Cause | Recovery Reading |
|---|---|---|---|
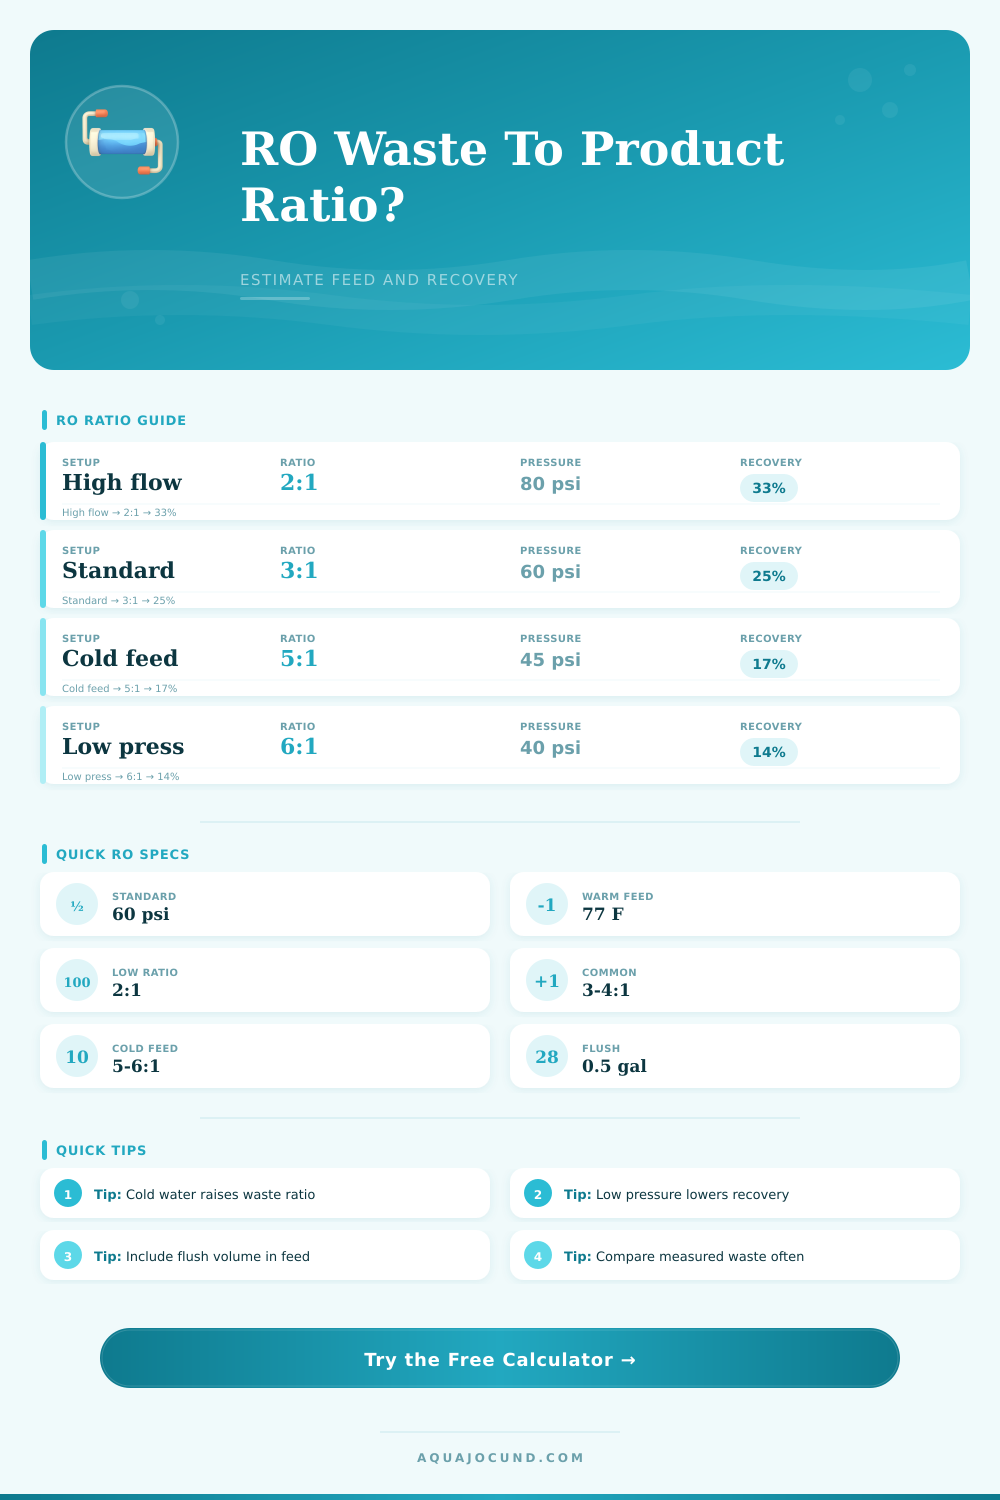
| 2:1 | 1 of 3 parts | High pressure or low waste setup | About 33% |
| 3:1 | 1 of 4 parts | Warm standard RO operation | About 25% |
| 4:1 | 1 of 5 parts | Common home aquarium baseline | About 20% |
| 5:1 to 6:1 | 1 of 6 to 7 parts | Cold feed or lower pressure | About 14% to 17% |
🌡Temperature Correction Table
| Feed Temperature | Relative Flow | Ratio Effect | Use In Calculator |
|---|---|---|---|
| 50 F / 10 C | About 52% | Waste ratio nearly doubles | Cold feed preset |
| 59 F / 15 C | About 66% | Waste ratio increases | Cool basement feed |
| 68 F / 20 C | About 82% | Slightly higher waste | Room temperature feed |
| 77 F / 25 C | 100% | Rated membrane point | Standard baseline |
🔧Pressure Effect Table
| Feed Pressure | Pressure Factor | Waste Trend | Recovery Trend |
|---|---|---|---|
| 40 psi / 2.8 bar | 0.67 | Higher waste ratio | Lower recovery |
| 50 psi / 3.4 bar | 0.83 | Moderate waste increase | Moderate recovery |
| 60 psi / 4.1 bar | 1.00 | Rated baseline | Baseline recovery |
| 80 psi / 5.5 bar | 1.33 | Lower waste ratio | Higher recovery |
🐟Common Aquarium RO Batch Table
| Aquarium Use | Product Water | At 3:1 Waste | Total Before Flush |
|---|---|---|---|
| Nano top-off | 1 gal / 3.8 L | 3 gal / 11 L | 4 gal / 15 L |
| Small water change | 5 gal / 19 L | 15 gal / 57 L | 20 gal / 76 L |
| Medium batch | 20 gal / 76 L | 60 gal / 227 L | 80 gal / 303 L |
| Large display batch | 40 gal / 151 L | 120 gal / 454 L | 160 gal / 606 L |
Test your RO output line. Take a sample. Perfect. Pour it in your tank. Next month when you see house bill, that’s when the smile fades. By design, reverse osmosis systems is thirsty. Understanding that thirst is how you avoid wasting half your municipal supply. For most hobbyists, waste line is a necessary evil but it acts as system’s pressure valve. Without that continual drain forcing rejected mineral out, the membrane can’t do its job.
Know the volume of water needed for that drain based off your set-up. That’s what the calculator here does. By inputting your desired volume of product water, it accounts for everything most people don’t think about until they get their bill. That includes temperature, pressure changes and restrictor ratio. In other words, it calculates exactly how many gallons of feed water you’ll need.
Why Your Water Filter Wastes Water
A typical 3 to 1 ratio may look straightforward on paper but it changes significanly if the water temp isn’t right or incoming water pressure has dropped. Running a system that’s pushing sixty psi with warm water is going to act very different than a system limping along at forty psi in the dead of winter, in the cold basement. You won’t know if your high waste output are normal or a cause for concern unless you account for that stuff. And that’s what the tool does, it accounts for all those variables so you’re not left wondering whether it’s normal or not.
Perhaps the largest silent thief of efficiency in a home filter is temperature. When water cools, it become more viscous, which means clean water doesn’t move through membrane pores as easily. At the same time, dissolved solids adheres to the membrane’s surface. In short: the system must push more wastewater to create flow. Without knowing it, you may experience slower production in winter months. Looking at the reference data below, you’ll see that a drop from 77°F to 50°F can reduce your relative flow almost by half. Your membrane didn’t break, the physics of cold water simply changed. Knowing this avoids any unnecessary panic or premature part replacement.
The other factor that matters just as much, but in more intuitive manner. Is pressure. Greater water pressure pushes more water through the membrane, increasing recovery rate and reducing waste ratio. Of course, you don’t want to crank up your home pressure so high that you risk damaging any fittings, or wearing out the membranes faster. The system aims for the sweet spot of sufficient pressure to increase production without leaking or otherwise prematurely clogging the membranes. But if you live with a municipal supply problem or are limited by low incoming pressure (for example because you live in an upstairs apartment), then you can be sure that your waste ratio will rise accordingly. This is not a defect, but just a physical constraint. Knowing about this tradeoff allow you to make an informed decision on whether investing in upgraded plumbing would improve your efficiency.
The amount of water going down the drain is also governed by condition of the membrane. An element that’s only filtered soft water doesn’t perform like an element that’s filtered hard or chlorinated water for two years. Scaling buildup slowly narrows flow as it filters, making it work harder. Flushing regularly reduces this and that’s why it’s important to calculate how much you are flushing. Those few minutes of unfiltered water going down the line clear out concentrated salt deposits that would otherwise sit on the membrane surface. It is a little investment of time but a big payoff in consistent performance and longevity.
But notice I said recovery percentage rather than raw gallons when looking at those results. That’s the measure of how well the process works. Depending on configuration, you’re looking at something around 25% to 33% being pretty good for an established system; less could be a sign of poor conditions or aging equipment. Tracking this over time helps establish your own baseline for what “normal” is in your own unique environment so you can catch sudden jumps in usage and get ahead of things like leaks/failures before they happen.
Filtration doesn’t need to be shut down completely for water conservation purposes. But it does demand careful attention. Be aware of what’s coming in, be mindful of temperature and pressure restrictions, and purge frequently. Then when you can account for each gallon, you realize that wasted water isn’t simply a quantity exiting the building. Instead it becomes an indicator of system health. This change how you think about maintaining the filter. And turns it from a pain-in-the-ass chore into something you manage effectivey.