RO Membrane Rejection Rate Calculator
Check actual membrane rejection, compare it with the rated spec, correct output for temperature and pressure, and forecast DI resin load.
⚙Real RO Scenarios
💧Membrane Test Inputs
Use tap TDS before the RO membrane.
Measure before DI resin for a true membrane check.
Mixed-bed resin capacity is often estimated in ppm-gallons.
Membrane Performance Result
📊Quick Comparison Grid
📋Membrane Rating Reference
| Membrane profile | Typical rating | Rated pressure | Expected rejection | Best aquarium use |
|---|---|---|---|---|
| 50 GPD thin film composite | 50 GPD / 189 LPD | 50 psi / 3.4 bar | 96% to 98% | Nano tanks and small mixing jugs |
| 75 GPD thin film composite | 75 GPD / 284 LPD | 50 psi / 3.4 bar | 96% to 98% | Most planted and reef aquariums |
| High rejection 75 GPD | 75 GPD / 284 LPD | 50 psi / 3.4 bar | 98% to 99% | Reef systems with DI resin polishing |
| High flow 150 GPD | 150 GPD / 568 LPD | 65 psi / 4.5 bar | 95% to 98% | Large water-change stations |
| Low pressure membrane | 75 GPD / 284 LPD | 40 psi / 2.8 bar | 95% to 98% | Homes without a booster pump |
🌡Temperature Correction Reference
| Feed temperature | Correction factor | 75 GPD output | What it means |
|---|---|---|---|
| 50°F / 10°C | 0.52 | 39 GPD / 148 LPD | Very slow winter production |
| 60°F / 16°C | 0.72 | 54 GPD / 204 LPD | Common cool tap-water result |
| 77°F / 25°C | 1.00 | 75 GPD / 284 LPD | Standard membrane rating point |
| 85°F / 29°C | 1.15 | 86 GPD / 326 LPD | Faster production with warmer feed |
🧪Rejection And DI Load Table
| Feed TDS | RO TDS at 98% | RO TDS at 96% | DI load at 10 gal/day | Resin impact |
|---|---|---|---|---|
| 100 ppm | 2 ppm | 4 ppm | 20 to 40 ppm-gal/day | Light load |
| 250 ppm | 5 ppm | 10 ppm | 50 to 100 ppm-gal/day | Moderate load |
| 500 ppm | 10 ppm | 20 ppm | 100 to 200 ppm-gal/day | High load |
| 750 ppm | 15 ppm | 30 ppm | 150 to 300 ppm-gal/day | Very high load |
💡Aquarium RO Testing Notes
| Check | Good practice | Why it matters | Calculator input affected |
|---|---|---|---|
| Flush before testing | Run the unit for 5 minutes | Clears initial TDS creep | Product TDS |
| Sample before DI | Use the RO-only line | DI hides membrane problems | Actual rejection |
| Check pressure running | Read pressure while producing water | Static pressure overstates output | Pressure factor |
| Use feed temperature | Measure cold tap water | Temperature changes GPD sharply | Corrected output |
One of the reasons a reef tank might go cloudy following a water change is because of a reverse osmosis membrane failure. However, it’s rarely an instant issue. Your DI resin will be compensating for any dissolved solids that the membrane lets through. Using a rejection rate calculator allow you to monitor this hidden variable to determine if your membrane is helping protect your system or costing more.
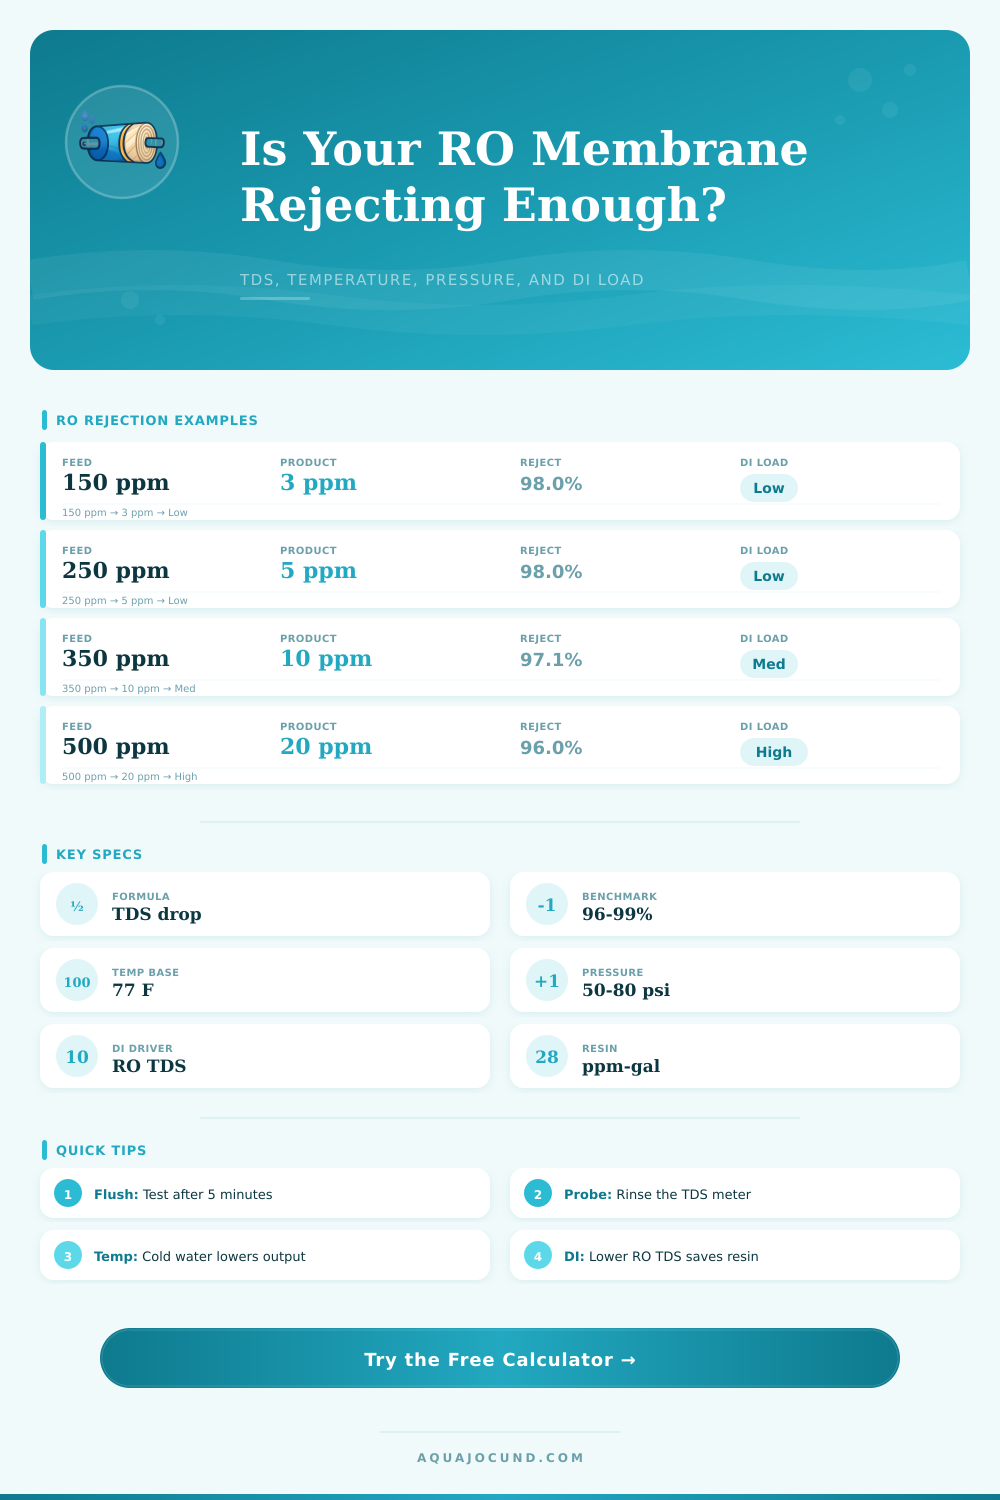
Membrane Rejection Rejection is good because it is just math. It is ratio between feed and product water solids blocked by the membrane. The feed water is 250 ppm. The product water is 5 ppm. Rejection rate: 98% if your feed water is 250 ppm and your product water is 5 ppm
How to Check Your RO Membrane Health
It looks good on paper, but it is not as advertised. Makes chart performance based off a certain set of pressure parameters and water temperature (77F). Your water might be colder and/or your static pressure less than what they tested at. This results in less output than specified, but a higher rejection rate that might sound like a good thing.
In colder regions, lower temperatures reduce RO efficiency due to viscosity of cool water. Because pure water is slow passing through the membrane’s pores, ions such as magnesium and calcium still find their way around imperfections. The reference tables shows a decrease in flow rates by almost half at 50 degree feed water versus rated specifications. While you’ll observe increased fill time of your reservoir, what you might not consider is effect on water quality as the membrane fights with viscosity. Rather than assuming room conditions, enter your actual feed temperature. This provides correct results.
To a degree, the greater the pressure, the greater amount of water that gets pushed through the membrane. Which improves rejection. And if the house pressure is lower, the unit might not get enough energy to realy separate out the salt. Your house may operate at lower then the fifty-psi threshold that units are rated against in general; you may have older pipes or be on a high floor. You don’t want to guess: Is my flow slow because of the pressure, or because the filters need replacing? The tool adjusts for real-world conditions to give you expected rejection and flow.
Perhaps the most useful output is DI resin load prediction. It calculates amount of contamination (ppm-gallons) that the resin has to handles on a daily basis. A drop in membrane rejection from ninety-eight to ninety-six percent means a doubling of product TDS. That double load cuts your DI cartridge life in half. This means more frequent changes, which impacts both logistics and cost for large reef systems requiring daily water changes. The calculator predicts when the resin will be exhausted so you can take action before nitrate spikes or pH crashes.
To test accurately, you need to be disciplined, you have to flush the system a few minutes to get any standing water out of the line and then take your TDS reading. To really assess RO performance, test right after the membrane and not after the polishing stages. Testing after the DI block tell you nothing about health of the membrane; it simply confirms that the resin is functioning.
Unless your rejection rate falls below 95% or you are running out of DI, don’t panic and change the membrane immediately. By monitoring those stats, you will understand the connection between the changes in your water source and how they affect the system’s output. Instead of waiting until it’s too late, you can make small adjustments to either the pressure or the pre-filters based on what you see. Without any guesswork about what occurs within the housing, you’ll be able to precisely determine the cleanliness of your input water during water changes. Your numbers becomes trustworthy. You don’t question if your instruments are lying to you.