Overfeeding Waste Estimate Calculator
Estimate uneaten feed, fecal solids, ammonia-nitrogen potential, nitrate rise, filtration or plant export, feeding frequency, and water-change offset from one feeding plan.
Waste estimate
Enter feeding details to estimate solids and nitrate load.
| Food profile | Protein | Moisture | Fecal solids factor | Overfeeding concern |
|---|---|---|---|---|
| Flake or micro granule | 40-46% | 6-10% | 18-25% | Floats, scatters, and can vanish into overflow teeth. |
| High protein pellet | 45-55% | 6-10% | 15-24% | Dense nitrogen source if portions are too large. |
| Sinking wafer or tablet | 28-38% | 7-12% | 24-35% | Breaks down in substrate if grazers do not finish it. |
| Frozen blend | 10-18% | 70-85% | 10-20% | Low dry mass but can add fine dissolved waste. |
| Prepared gel food | 15-24% | 55-75% | 18-30% | Soft particles can be trapped in prefilters. |
| Reef feed food | 14-25% | 60-85% | 8-18% | Small particles feed corals and also sump detritus. |
| Fry powder or crumble | 48-58% | 5-10% | 20-32% | Fine particles make heavy growout feeding easy to overshoot. |
| Tank example | Dimensions | Volume | 0.25 g uneaten feed adds | Use in this calculator |
|---|---|---|---|---|
| 10 gal nano | 20 x 10 x 12 in / 51 x 25 x 30 cm | 10 gal / 38 L | About 1.9 ppm NO3 at 42% protein, 75% conversion | Small tanks show waste spikes quickly. |
| 20 long | 30 x 12 x 12 in / 76 x 30 x 30 cm | 20 gal / 76 L | About 0.9 ppm NO3 | Good baseline for community feeding checks. |
| 40 breeder | 36 x 18 x 16 in / 91 x 46 x 41 cm | 40 gal / 151 L | About 0.5 ppm NO3 | Useful for goldfish, growout, and reef feeding. |
| 75 gal display | 48 x 18 x 21 in / 122 x 46 x 53 cm | 75 gal / 284 L | About 0.3 ppm NO3 | Large systems dilute mistakes but still accumulate weekly. |
| 125 gal system | 72 x 18 x 21 in / 183 x 46 x 53 cm | 125 gal / 473 L | About 0.1 ppm NO3 | Best modeled with sump and export offset included. |
| Export method | Typical entry | What it offsets | Calculator note |
|---|---|---|---|
| Manual siphon after feeding | 10-40% of uneaten solids | Visible food and fecal particles | Use a higher eaten percentage or lower decay factor if removed quickly. |
| Mechanical prefilter cleaning | 5-25% source reduction | Trapped particles before they mineralize | Only counts if cleaned before decay releases nitrogen. |
| Plant uptake | 0.05-2 ppm NO3/day | Dissolved nitrate | Fast growth exports more than old shaded growth. |
| Protein skimming / reef export | 5-35% source reduction | Dissolved organics and fine particles | Enter as percent when estimating broad export efficiency. |
| Denitrification / refugium | mg/day or ppm/day | Dissolved nitrate | Use measured nitrate trend when available. |
| Schedule | Offset style | Best fit | Planning note |
|---|---|---|---|
| 10% weekly | Small nitrate reset | Lightly fed planted tanks | Overfeeding remains visible as a slow weekly climb. |
| 25-30% weekly | Moderate reset | Community aquariums | Common baseline for comparing feeding changes. |
| 40-50% weekly | Strong reset | Goldfish, cichlid, or growout systems | Controls peaks but does not remove settled waste automatically. |
| 20% twice weekly | Smoother peaks | Heavy feeding with sensitive stock | Short intervals reduce the pre-change nitrate high point. |
| Large monthly change | Large swing | Low-load systems only | Long intervals can exceed target before the change occurs. |
Even after feeding them, you might see those hungry-looking fish and feel inclined to feed again. It seems generous. However, this act of kindness poisons your closed environment.
While uneaten food create a lot of waste, it isn’t the only factor; even if fish eat every single flake, their bodies still excrete nitrogenous waste. That uneaten food feeds bacteria, which generate waste, all invisible beneath the surface. While most keeper monitor floating flakes, they don’t notice dissolved pollutants beneath.
Why Overfeeding Harms Your Tank
Two waste streams, solid and dissolved, is tracked to calculate this invisible cost. Fecal matter and sinking pellets are solids. They rot in substrate and clog filters. More problematic is dissolvded nitrogen. It happens because of how food are made; everything contains some protein. Even when fed 100% of what’s offered, amino acids gets broken down inside the fish’s body and eliminated as nitrogenous waste.
Why should you care? The answer is nitrates. Gravel vacuums can’t suck up dissolved ions. Measuring chemical load feels like a vague idea…until plants turns yellow or water goes cloudy.
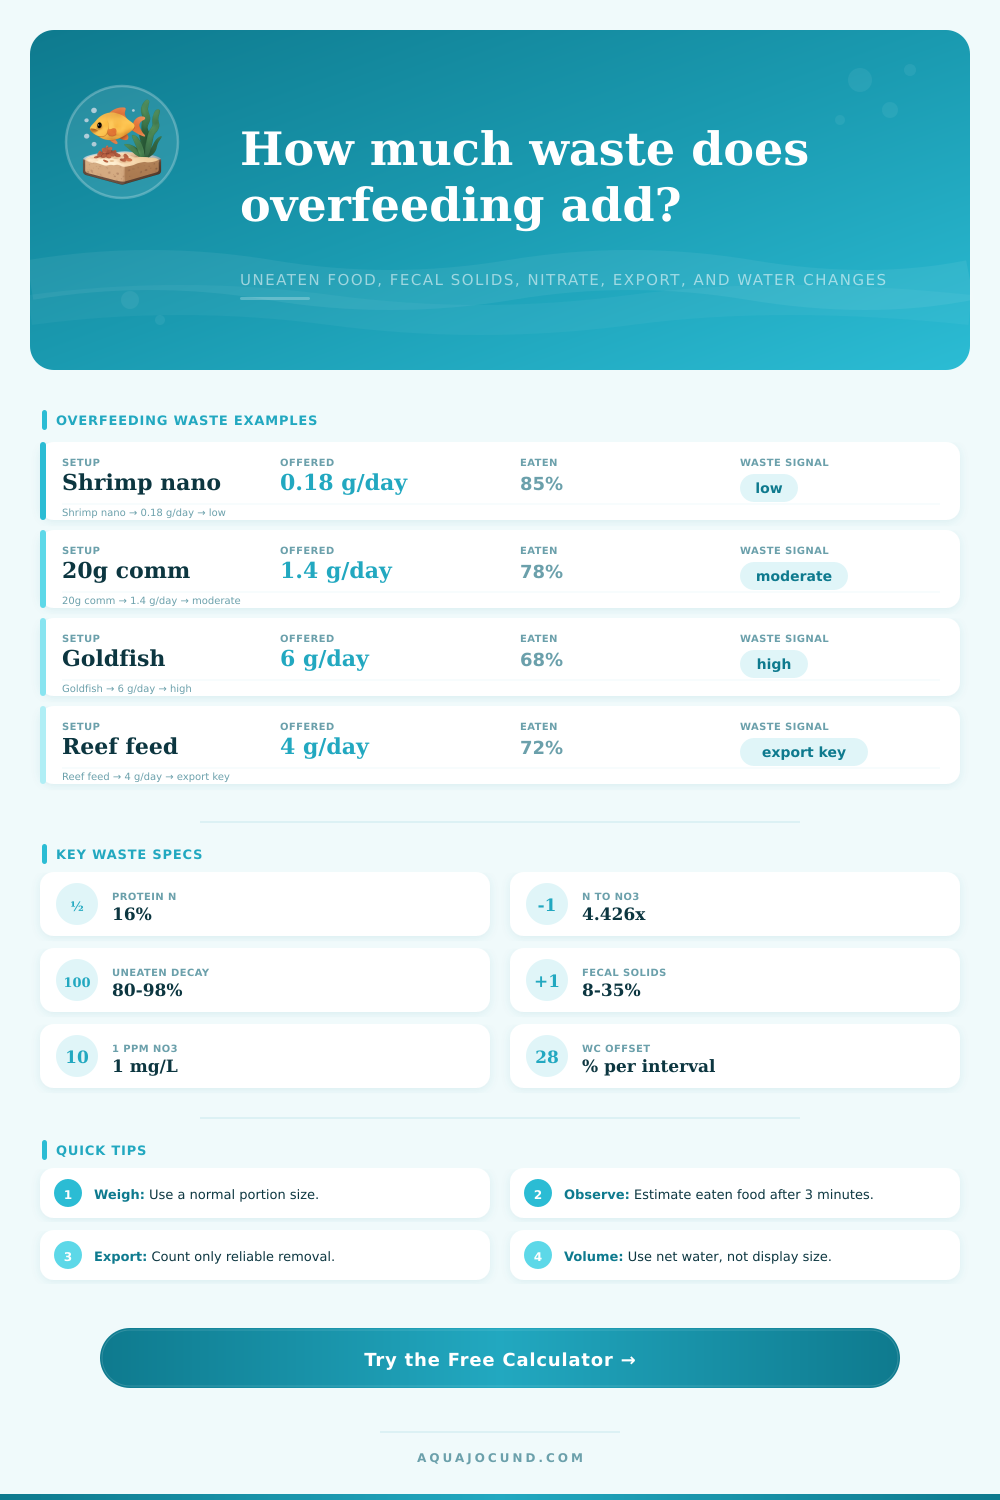
The ate-it-percentage need to be calibrated to real life to get your picture right. If you give one gram of food and guess that 70% goes missing, the calculator treats the remainder (30%) as waste. A decay factor is then applied to decide what fraction becomes nitrates instead, or what fraction gets sucked out during cleaning.
That’s key since a frequently-vacuumed, sloppy tank will behave very different than a heavily-planted tank whose roots soak up excess. The reference table give you a sense of those factors and how various kinds of feeds change the ratio of solid bulk vs chemical load.
Also tweak protein content with care. Protein-rich pellets fuel betta growth, but leave a larger nitrogen footprint compared to algae wafers for pleco. The more protein you add, the higher that nitrate levels will spike.
Protein skimming (commonly used in reef tanks) do more than remove particulates, it intercepts dissolvable organics before they convert into nitrate. Unless your tank has strong biological export (such as powerful filtration or heavy plant growth), excess protein-derived nitrogen remain suspended in water column. This buildup is why regular water changes are such an effective safety valve.
Nitrate will accumulate in between scheduled partial water changes. By plotting the model, you can find out if you need to adjust your schedule for achieve better results. In some cases, a tiny weekly water change may be all that’s necessary (e.g., a lightly fed nano tank). In other case, much more is needed to offset amount of nitrogen and solids generated (e.g., a goldfish pond). Adjust the size and interval based off what works best; balancing water quality stability with effort required to maintain it.
Most people do not feed their tanks too much out of malice; they simply don’t imagine how small errors adds up over time. A single extra pinch doesn’t seem like a big deal… until thirty days pass and your habits cause a noticeable change in your water’s chemistry.
Rather than being judgemental, the calculator shows you what happens when you feed certain portions. You can see how much solid waste will be produced and how much nitrate levels rises. That way, you’ll know when to back off before water quality problems arise.
It’s easier to prevent an imbalance than fix one, so use numbers to prevent an algae outbreak rather than waiting to react to it. Holding back is hard-wired into our brains as a bad idea, but cleaner water proves that moderation rewards us.