Fish Biomass Total Calculator
Estimate total stock weight, daily feed, density, filtration load, and oxygen reserve from count, length, or average weight.
⚙Calculator inputs
Biomass estimate
Enter fish and system details, then calculate.
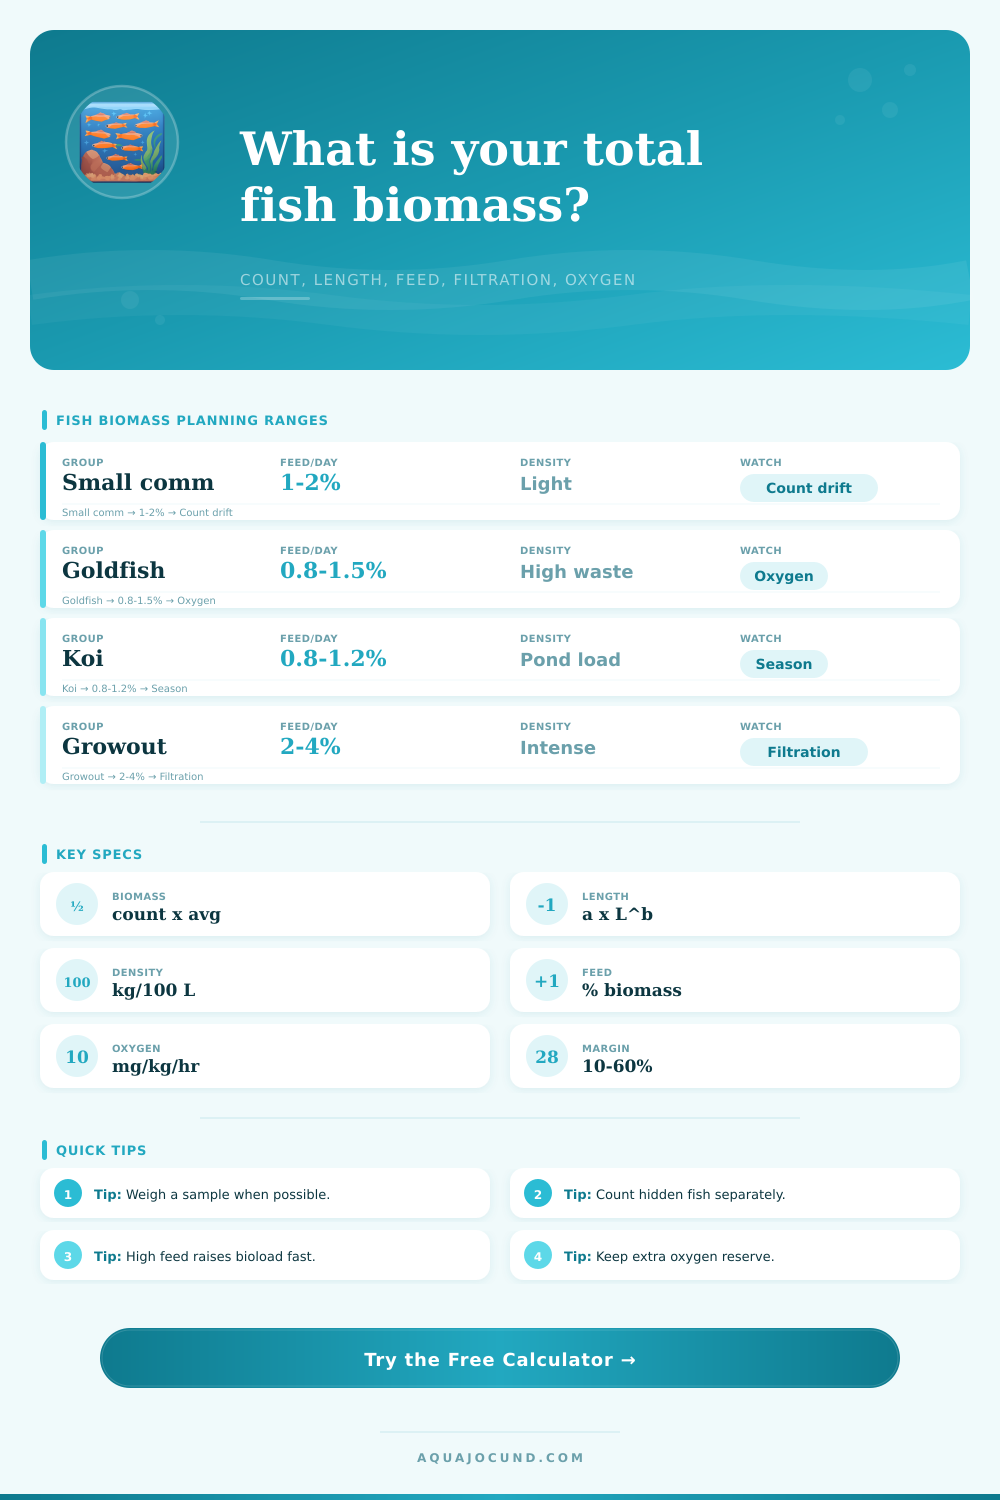
📊Species biomass comparison grid
⚖Selected group quick specs
📋Species coefficient table
| Species group | Length-weight curve | Typical feed | Waste factor | O2 planning rate |
|---|---|---|---|---|
| Small schooling fish | 0.012 x Lcm^3.00 | 1.5%/day | 0.75x | 250 mg/kg/hr |
| Livebearers | 0.013 x Lcm^3.05 | 1.8%/day | 0.90x | 280 mg/kg/hr |
| Cichlids | 0.018 x Lcm^3.05 | 1.2%/day | 1.10x | 220 mg/kg/hr |
| Goldfish | 0.020 x Lcm^3.02 | 1.0%/day | 1.55x | 190 mg/kg/hr |
| Koi and pond carp | 0.021 x Lcm^3.05 | 1.0%/day | 1.45x | 170 mg/kg/hr |
| Catfish and plecos | 0.016 x Lcm^3.10 | 0.8%/day | 1.30x | 150 mg/kg/hr |
| Marine community fish | 0.014 x Lcm^3.00 | 1.2%/day | 1.00x | 240 mg/kg/hr |
| Tilapia and growout fish | 0.019 x Lcm^3.00 | 2.5%/day | 1.35x | 210 mg/kg/hr |
🧪Filtration class reference
| Filtration class | Base capacity | Typical use | Turnover target | Planning note |
|---|---|---|---|---|
| Gentle sponge or low-flow | 0.30 kg/100 L | Small fish, fry, calm flow | 2-4x/hr | Keep density conservative |
| Standard mature filter | 0.60 kg/100 L | Community aquariums | 4-6x/hr | Best for moderate feeding |
| Robust canister or sump | 0.95 kg/100 L | Cichlid or mixed tanks | 6-8x/hr | Needs steady oxygen |
| High-bioload filter | 1.25 kg/100 L | Goldfish or large fish | 7-10x/hr | Water oxygen becomes limiting |
| Growout or aquaculture | 2.20 kg/100 L | Managed feeding systems | 10-20x/hr | Assumes active aeration |
| Pond biofilter | 1.60 kg/100 L | Koi and pond fish | 1-3x/hr pond | Season affects oxygen reserve |
📐Common biomass scenarios
| Scenario | System volume | Example stock | Approx biomass | Daily feed at typical % |
|---|---|---|---|---|
| Nano community | 10 gal / 38 L | 10 small fish, 1.2 in | 0.08 lb / 0.04 kg | 0.6 g/day |
| Community 55 | 55 gal / 208 L | 24 mixed fish, 2 in | 0.7 lb / 0.32 kg | 5 g/day |
| Goldfish | 75 gal / 284 L | 3 fancy goldfish, 6 in | 1.8 lb / 0.82 kg | 8 g/day |
| Cichlid display | 125 gal / 473 L | 18 cichlids, 4.5 in | 4.3 lb / 1.95 kg | 23 g/day |
| Koi pond | 1500 gal / 5678 L | 8 koi, 16 in | 43 lb / 19.5 kg | 195 g/day |
🔢Estimate method guide
| Method | Best input | Strength | Weak spot |
|---|---|---|---|
| Average weight entered | Scale weight from a sample fish | Most direct biomass total | Misses size spread if sample is poor |
| Length-weight estimate | Average total length | Fast when weighing is not practical | Species body shape changes the result |
| Blend weight and length | Both average weight and length | Smooths rough field estimates | Only as good as both averages |
| Confidence allowance | Expected counting accuracy | Adds reserve for hidden stock | Not a substitute for inventory checks |
I know you think: “If the fish are still alive then my tank must be OK.” Nope. That’s just not how aquarium biology work. Fish release metabolic waste, such as ammonia, right back into the water. So volume doesn’t tell you much at all regarding capacity. A 50g with 30 small fish isn’t necessarily the same as one with 3 large koi. The weight of livestock is what drives all changes in your system. It is not the water displacement that matters; it is the biomass!
The calculator take the visual clutter (count and average size) and translates it into hard numbers. You enter the number/size and get the total mass of your stock. This is the anchor from which everything else come. With an idea of the biomass, you can accurately guess how much to feed daily and avoid overfeeding. While many people obsess about strength of their filtration, they fail to recognize importance of feeding discipline.
Why Fish Weight Is More Important Than Water Volume
If you estimate that you have twice as much biomass as expected, then you’re dosing your filter with double the amount of waste then it can handle. This tool takes into account what you’re loading it with in comparison to regular filtration classes and indicates if you require a strong sump setup or just a single sponge filter.
To add some needed complication: Fish aren’t cylindrical, uniform objects. For instance, a 10″ long eel will weigh far less than a 10″ long cichlid (eels being thin and elongated). To account for these differences among species, we added coefficients into the calculator. These coefficients accounts for how deep and dense their bodies are. This allows you to avoid one of the biggest mistakes I’ve seen hobbyists make. Assuming all fish of equal length hold an equal amount of bioload. That’s a risky position; you can be maintaining what appears to be a perfectly healthy tank until it suddenly goes belly up from a crash.
Additionally, you can toggle condition factor if you want to fine tune your model to reflect whether your fish are heavy with food stores or lean. A fuller fish is heavier (and therefore eats more too), which means tweaking this number increase the accuracy of your model. When there’s too much biomass, the main problem is usually that oxygen runs out due to poor planning. Metabolic activity by live fish quickly uses up oxygen, which is harder to hold in warm water. To prevent us from nearing hypoxic conditions, the calculator accounts for temperature along with a safety margin as well.
So if the result tells you your filter can handle just about every last drop, or even beyond; you’re maxed out. Adding any additional fish under these circumstances is a recipe for disaster. There must be space for the fish to breathe and for your biological bacteria, which do all the heavy lifting to convert ammonia. The comparison grid inside the tool draws attention to the fact that certain species stress a system much more than others. For example, goldfish produce large amounts of waste compared to other fish their size; they’ll need a heavier-duty filtration system than say small tetra species.
A second quiet killer is hidden stock. This includes juvenile additions from breeding events or growth of existing juveniles. These can suddenly double your biomass overnight without you noticing anything happening. A lower confidence percentage in the inputs provides a buffer for all this unseen addition, forcing you to plan for the worst case rather than what you see now. It’s an inherently conservative approach which conserves more fish than any aggressive stocking could of save.
The accompanying table with reference values provides quick calibration points for expected waste factors and feeding rates so you can use common sense norms as a standard for what to expect. There is no need to memorize the coefficients, but knowing they exist will make you think differently about maintenance schedules. So managing biomass isn’t a target but rather the recognition of biological limitations. That translates guesswork into bite-size pieces of information to manage.
Once you have an idea of what you have, you don’t react; you prevent. The water cleans itself, the load stays within the limits, and the fish stay healthy without needing a vet. Turns out that knowing how much is in the tank is the most critical thing for keeping it alive. Actualy, knowing how much livig biomass is in there is more important than anything else. It makes things feel much more comfortabley.