Fish Weight From Length Girth Calculator
Estimate individual fish weight, sample biomass, body condition, and confidence range from length, girth, body shape, and species class.
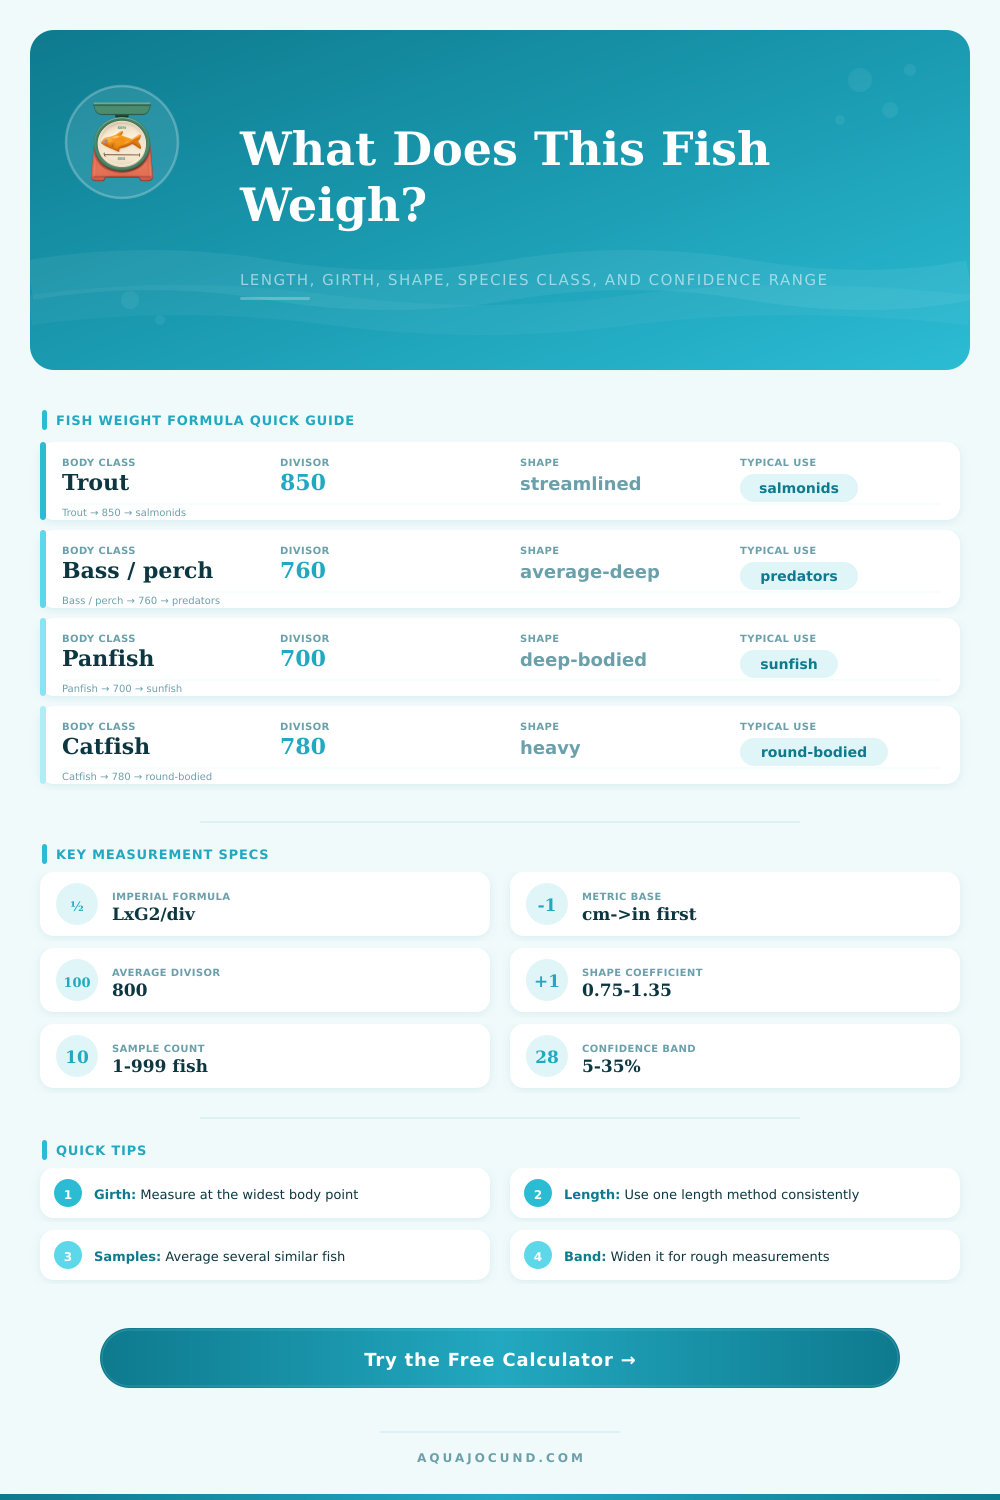
| Species class | Formula divisor | Body tendency | Best matching coefficient | Notes for estimate |
|---|---|---|---|---|
| General fish | 800 | Average oval | 1.00 | Useful when species-specific data is unavailable |
| Trout | 850 | Streamlined | 0.92-1.00 | Use lower coefficient for lean river fish |
| Bass / perch | 760 | Average-deep | 1.00-1.08 | Common gamefish field approximation |
| Walleye / zander | 820 | Moderately slender | 0.92-1.00 | Often lighter than bass at the same girth |
| Panfish / bream | 700 | Deep-bodied | 1.08-1.18 | Deep sides increase weight quickly with girth |
| Catfish / bullhead | 780 | Round-bodied | 1.08-1.20 | Use actual girth carefully behind pectoral area |
| Carp / koi | 740 | Heavy-bodied | 1.12-1.28 | Condition varies strongly by season and strain |
| Pike / gar | 980 | Very slender | 0.82-0.92 | Long fish with low girth need a larger divisor |
| Example fish | Length | Girth | Class used | Approx weight |
|---|---|---|---|---|
| Stocky bluegill | 10 in / 25 cm | 7 in / 18 cm | Panfish | 0.7 lb / 0.3 kg |
| Rainbow trout | 12 in / 30 cm | 7 in / 18 cm | Trout | 0.7 lb / 0.3 kg |
| Largemouth bass | 18 in / 46 cm | 12 in / 30 cm | Bass | 3.4 lb / 1.5 kg |
| Coho salmon | 24 in / 61 cm | 14 in / 36 cm | Trout | 5.5 lb / 2.5 kg |
| Channel catfish | 30 in / 76 cm | 18 in / 46 cm | Catfish | 13.5 lb / 6.1 kg |
| Northern pike | 36 in / 91 cm | 14 in / 36 cm | Pike | 7.2 lb / 3.3 kg |
| Confidence band | Use when measurements are | Range effect on 5 lb fish | Practical note |
|---|---|---|---|
| 5% | Careful measuring board and snug girth tape | 4.75-5.25 lb | Good for repeated sample protocols |
| 10% | Normal field measurement | 4.50-5.50 lb | Balanced for most calculator use |
| 15% | Fish flexing or girth not perfectly square | 4.25-5.75 lb | Use when one dimension is estimated |
| 25% | Photo, quick release, or rough tape reading | 3.75-6.25 lb | Better for broad planning than precise records |
| 35% | Estimated girth from length only | 3.25-6.75 lb | Girth uncertainty dominates weight error |
| Sample count | Average fish weight | Total biomass | Metric equivalent | Common calculation use |
|---|---|---|---|---|
| 1 fish | 1.5 lb | 1.5 lb | 0.7 kg | Single specimen estimate |
| 5 fish | 1.5 lb | 7.5 lb | 3.4 kg | Small comparison sample |
| 20 fish | 0.4 lb | 8.0 lb | 3.6 kg | Juvenile batch estimate |
| 50 fish | 0.25 lb | 12.5 lb | 5.7 kg | Tank or pond sampling summary |
| 100 fish | 0.1 lb | 10.0 lb | 4.5 kg | Population average projection |
How many times have you set the hook into a fish only to wonder how large it is? You get a sense from the line and the look of the fish coming out of the water, but you don’t know actualy what size it is. Your eyes lie about the size too because the water distorts the speed and bending of light which makes estimating visually a bad choice. Instead measure its length and girth for real numbers you can believe in.
Volume is where the math comes into play with this estimate. Multiplying length times girth will not give an exact weight since fish are not perfect cylinders. To adjust for their species and shape you need a divisor that will compensate for deep bodied bass compared to a pike (which is more slender) or even a carp (which is flatter). In addition, factors like body fat content change how much a fish weighs by its size. Is it a plump, fat carp? Or is it a sleek trout? By using certain numbers assigned to each category (streamlined predator or heavy bottom feeder), you can just concentrate on measuring correctly without getting too tied up in the Algebra.
How to Measure Fish Correctly
The biggest trap is on the girth measure. On almost every fish, this will be measured at base of the dorsal fin or right behind the head (just above the middle). When it squirms, the measuring tape can slide down on its side or get looser, so it’s actually reading across a diagonal. This exaggerates size and makes your measurement larger than it actualy is. Tight = big; Loose = small. But how do you measure a wiggling animal? You don’t; there is no ideal method. That’s why we have confidence intervals. A field estimate isn’t going to be as exact as a lab measurement, so the tool allow you to adjust the margin for error.
This explains why species choice matter and how the divisor works. Think of it like a shape correcting factor. A deep round fish requires a lower number, a lower divisor, because this raises the estimated weight. On the other hand, a thin elongated fish demand a higher divisor because this lowers the estimated weight. Plugging in a walleye with the panfish setting yields an almost twenty percent variance in your answer. This is enough to make a difference between a tackle record and a feed calculation on aquaculture fish. The table below illustrates how body tendency link to specific numerical adjustments. While you don’t have to remember these numbers, having some idea they exist aids in making the correct category at the outset.
For pond management and serious anglers, there is another neat feature that lets you take a sample of the biomass. If you’re trying to manage a fishery or stock a lake, knowing the weight of 20 fish of that same size help you estimate available resources. In other words, instead of focusing on one fish you just caught, think about the overall population. This way you can multiply your guess by however many samples you’ve taken. Now you have a ballpark number to work from whether it’s determining harvest limits or figuring out where to feed them next. Not perfect, but a lot better than flying blind.
Fish condition is also hugely affected by seasonality. The same bass will be different in late summer then it was in the spring before spawning. The body condition adjustment factors take into consideration both muscle fullness and fat storage. Failing to consider this factor can result in overestimating a spent post spawner, or underestimating a well fed fall fish. Although subtle, these adjustments matter when trying to track fish growth rates over time.
There’s nothing more to it than math and observation; there are too many variables in nature to avoid them all, but we can make our estimates as accurate as possible by making sure we’re doing things the same way each time. Stay within the capabilities of your tape measure and let the formula do its work. Those little details when measuring up will pay off when you log those numbers at the end and compare ‘em on the scales. It makes that fuzzy recollection of a battle into something concrete. And that sense of accomplishment is well-worth an additional half-minute spent wrapping the tape properley.