Salinity to Specific Gravity Calculator
Convert aquarium salinity in ppt to temperature-aware specific gravity with calibration, density correction, target range, and meter mode.
🎯Quick Presets
⚙Calculator Inputs
📊Salinity / SG Comparison Grid
🌊Salinity Class Reference
| Class | Typical ppt | Approx SG at 25C | Calculator note |
|---|---|---|---|
| Fresh reference | 0 ppt | 1.0000 | Pure water baseline |
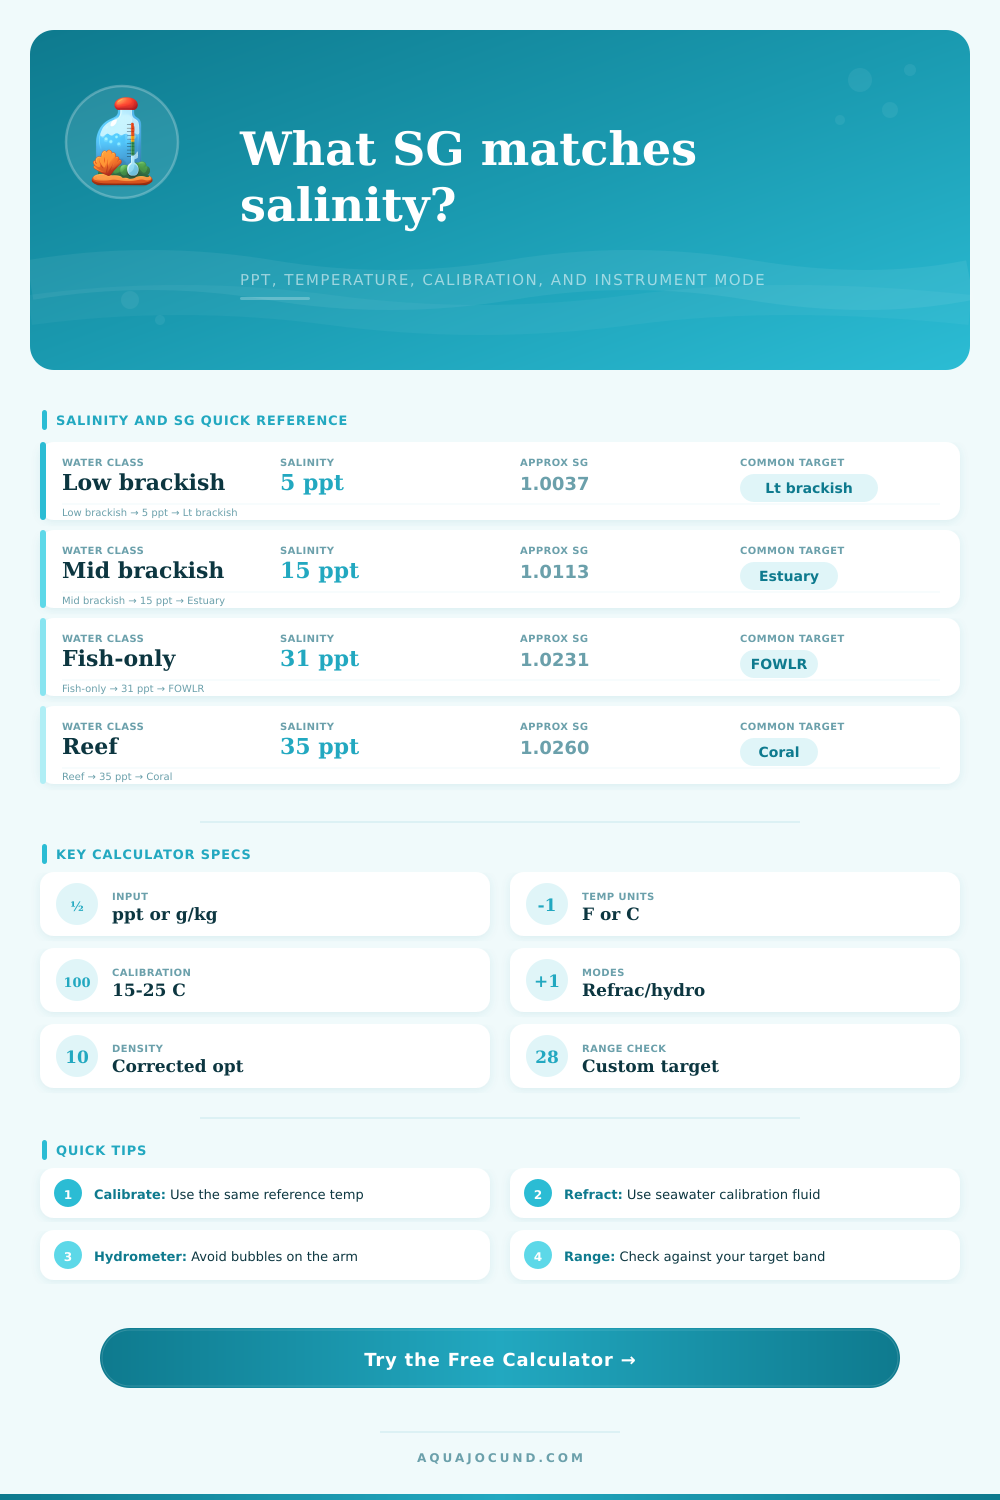
| Low brackish | 5 ppt | 1.0037 | Small SG changes are easy to miss |
| Mid brackish | 15 ppt | 1.0113 | Use ppt when possible |
| Hyposalinity QT | 12-16 ppt | 1.0090-1.0121 | Calibrated meters matter |
| Fish-only | 30-33 ppt | 1.0224-1.0246 | Common FOWLR band |
| Reef aquarium | 34-35 ppt | 1.0253-1.0260 | Common coral target |
| High salinity reef | 37-38 ppt | 1.0275-1.0282 | Check evaporation drift |
🧪Instrument Mode Reference
| Mode | What it represents | Correction behavior | Best use |
|---|---|---|---|
| Seawater refractometer | SG scale for seawater | Uses density and calibration temp | Reef and marine checks |
| ATC refractometer style | Temperature-compensated display | Softens sample/calibration difference | Room-temperature testing |
| Glass hydrometer | Density float scale | Applies full sample temperature effect | Still samples read at eye level |
| Swing-arm hydrometer | Plastic arm estimate | Adds small typical arm bias | Planning, not final calibration |
| Lab density ratio | Calculated density ratio only | No instrument bias | Comparing formulas |
| Conductivity meter estimate | SG inferred from ppt | Small conductivity conversion allowance | Ppt-first meters |
🌡Temperature and Calibration Reference
| Sample temp | 35 ppt density | SG vs 25C water | Practical note |
|---|---|---|---|
| 68°F / 20°C | 1.0248 kg/L | 1.0278 | Cool samples read denser |
| 72°F / 22°C | 1.0243 kg/L | 1.0272 | Common room sample |
| 77°F / 25°C | 1.0233 kg/L | 1.0262 | Standard reef comparison |
| 80°F / 27°C | 1.0226 kg/L | 1.0255 | Warm reef display |
| 84°F / 29°C | 1.0218 kg/L | 1.0246 | Warm samples read lighter |
📏Common Target Bands
| Target use | PPT band | SG band at 25C | Range entry idea |
|---|---|---|---|
| Low brackish display | 4-8 ppt | 1.0030-1.0060 | 1.0030 to 1.0060 |
| Mid brackish display | 12-18 ppt | 1.0090-1.0135 | 1.0090 to 1.0135 |
| Hyposalinity quarantine | 12-16 ppt | 1.0090-1.0121 | 1.0090 to 1.0120 |
| Fish-only | 30-33 ppt | 1.0224-1.0246 | 1.0220 to 1.0250 |
| Reef aquarium | 34-35 ppt | 1.0253-1.0260 | 1.0250 to 1.0265 |
| High salinity reef | 37-38 ppt | 1.0275-1.0282 | 1.0270 to 1.0290 |
Now you’re standing next to your reef tank holding your refractometer and staring at a drop of water as it covers prism. The separation between light and dark is crisp. Yet somehow it doesn’t feel real to you until you convert it to a value your fish know how to understand. That’s where specific gravity comes in.
It’s not a synonym for salinity. It’s actualy a measurement of how dense the water is. This depend on several factors, including how the instrument is calibrated, the temperature, and even how firmly you press device against the water. The calculator above does calculations for you. Don’t worry about converting values. Instead, focus on whether your salt mix is a little low or high by fractions of points and whether your corals is starving or happy.
What Is Specific Gravity?
The next challenge is understanding why. Temperature do matter. Specifically, water gets denser as it cools and less dense (i.e., expands) when it warm. That is true whether there is salt dissolved in it or not. In other words, the amount of dissolved salt may remain constant but the water’s density change.
If you use a device that isn’t compensated for that change, a sample collected from your heated sump would have different reading than if sampled at room temperature. Since most of us think of salinity as being a fixed property, we don’t recognize that it can change. How much? The chart on the page shows how much the readings changes depending on the temperature (heating or cooling). Bottom line, measuring at variable intervals give you confusing log results.
This brings us back to meters. Which correction model do you use? That depends on what kind of meter you’re using. Glass hydrometers is buoyant. Yes, those depend directly on thermal expansion of the sample. Refractometers measure light refraction. Yes, this depends on dissolved solids. It also depends on temperature if it isn’t automatically compensated.
In any case, the tool lets you choose the instrument mode and adjusts its output to match. This prevents you from making mistakes like comparing a refractometer reading today to a hydrometer reading from last week without accounting for different physics involved. It’s not just about salt. It’s about how that salt behave in relation to volume or light under given conditions.
The second common failing is calibration. While many users calibrate their meters using pure distilled water as a zero reference, few account for checking against a sea water standard near their working range. Even a meter that’s spot on in fresh water will sometimes wander badly by the time it reach marine levels. Before these non-linear inaccuracies impact your fish, use calibration fluid that matches your tank parameters. That way you’ll see the inaccuracies before they show up on your livestock.
If you have confidence in knowing your meter is running high or low, just enter the offset into the calculator. That provide yet another level of accuracy over out-of-the-box factory settings. What’s in the tank determines your target range. If it’s a fish only tank then it’s forgiving. You can swing all day long without stressing out any of those sensitive SPS corals.
If it’s a high tech reef then things has to be stable in a tight range. That range is usually between 1.025 and 1.026 specific gravity at normal reference temperature. Below that and you risk bleaching or stunting growth. Above that and you’ll cause osmotic stress to both your fish and other invertebrates.
That’s where the presets comes into play. They cover typical situations ranging from brackish estuary tanks to high salinity coral tanks. That allows you to set up a starting point from which you can tweak manually as needed.
The silent saboteur in this scenario is evaporation. Evaporation removes water but not the salt. Over time this will push your specific gravity upwards. It’s slow enough that you won’t notice day to day. If it’s allowed to continue week after week however, it can become problematic. Adding the right amount of water and testing regularly will keep you in that delicate balance without always having to chase the reading.
The point is to get as close as you can but do what you can to be consistent. Even if it’s not perfect, your fish acclimate to that routine, and it becomes their normal, even if it doesn’t match what’s in the books. The numbers comes from the tool. But the routine comes from checking things regularly, which will create the stable environment that your tank requires.
From a drop of water to an ecosystem, you bridge the gap between life and numbers one reading at a time.