NH3 NH4 Ratio Calculator
Estimate un-ionized NH3 fraction and ammonium NH4 share from TAN using pH, temperature, salinity or ionic strength, tank volume, threshold, and water change dilution.
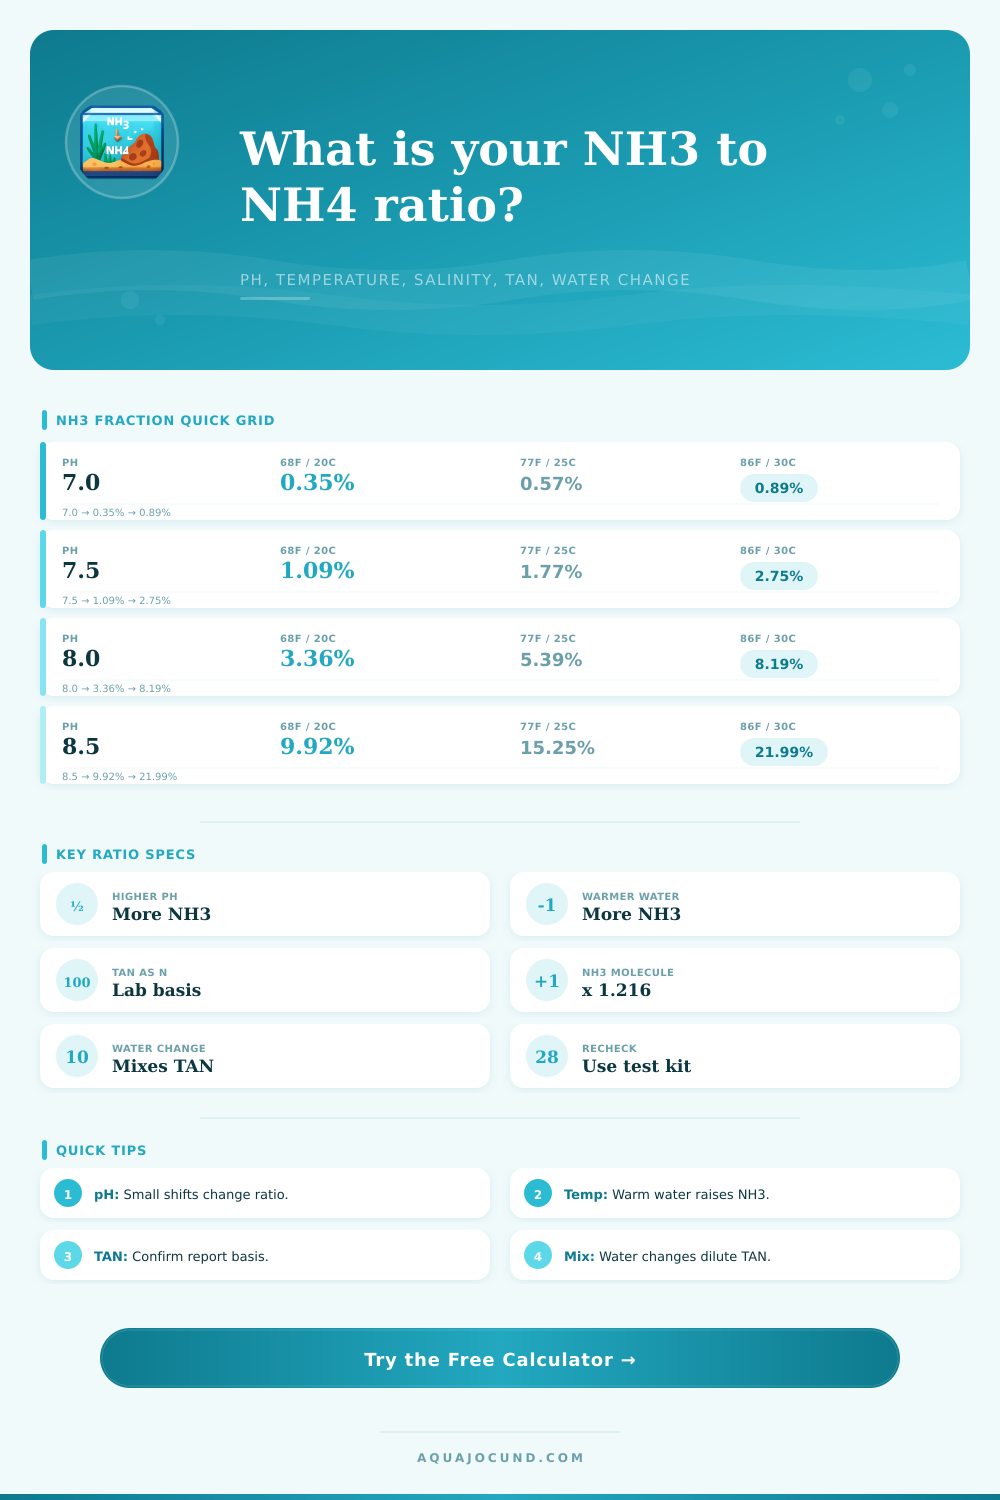
NH3 / NH4 ratio snapshot
Results update from TAN, pH, temperature, salinity or ionic strength, threshold, and water change inputs.
| Condition | pH | Temperature | Approx NH3 fraction | Ratio note |
|---|---|---|---|---|
| Cool soft freshwater | 6.8 | 68°F / 20°C | 0.22% | Mostly NH4 at low pH. |
| Neutral community tank | 7.2 | 77°F / 25°C | 0.91% | NH3 remains a small portion of TAN. |
| Alkaline freshwater | 8.2 | 78°F / 26°C | 8.5% | pH shift strongly increases NH3. |
| Warm hardwater system | 8.4 | 84°F / 29°C | 16-18% | Warmth and high pH combine. |
| Reef salinity comparison | 8.2 | 78°F / 26°C | 8-10% | Salinity correction is smaller than pH effect. |
| Preset | pH | Temp | Salinity | Typical calculation use |
|---|---|---|---|---|
| Nano Low pH | 6.8 | 76°F / 24°C | 0 ppt | Soft freshwater TAN split. |
| Community 20 | 7.4 | 78°F / 26°C | 0 ppt | Neutral freshwater comparison. |
| Planted Softwater | 6.9 | 77°F / 25°C | 0 ppt | Lower pH planted systems. |
| Goldfish Alkaline | 8.0 | 72°F / 22°C | 0 ppt | Cooler but higher pH water. |
| Cichlid Hardwater | 8.3 | 80°F / 27°C | 0 ppt | Hard alkaline freshwater. |
| Brackish Tank | 8.1 | 79°F / 26°C | 12 ppt | Mixed salinity planning. |
| Reef System | 8.2 | 78°F / 26°C | 35 ppt | Marine ionic strength comparison. |
| Summer Pond | 8.4 | 86°F / 30°C | 0 ppt | Warm outdoor water. |
| Transport Bag | 7.0 | 75°F / 24°C | 0 ppt | Low-pH holding water estimate. |
| Reported value | Means | Convert to as N | Convert to NH3 molecule |
|---|---|---|---|
| mg/L as N | Nitrogen mass in TAN | Use directly | Multiply by 1.216 |
| mg/L NH3-N | Same nitrogen basis for ammonia | Use directly | Multiply by 1.216 |
| mg/L NH3 + NH4 | Molecule mass basis | Divide by 1.216 | Use directly |
| Percent NH3 | Fraction of TAN un-ionized | Multiply by TAN as N | Then multiply by 1.216 |
| Input | Low value effect | High value effect | Calculator treatment |
|---|---|---|---|
| Water change percent | Small TAN dilution | Large TAN dilution | Mixes remaining tank TAN with replacement TAN. |
| Replacement pH | Can reduce NH3 fraction | Can raise NH3 fraction | Blends toward after-change pH by water-change percent. |
| Replacement temperature | Lower NH3 fraction | Higher NH3 fraction | Blends current and replacement temperature in degrees C. |
| NH3 threshold | Stricter comparison | Looser comparison | Compares current and after-change NH3 as nitrogen. |
Sure, you check your water in your tank because you care about the safety of it for your fish. You don’t do it because you love doing homework in Chemistry class. If you use a kit that provides a total ammonia nitrogen number, the number you have are hiding a dangerous variable. It combines the toxic un-ionized ammonia gas and non-toxic ammonium ion into one simple number. And here’s the thing, fish suffer from the latter (gas) more then the former (ion). Understanding this distinction turns an ambiguous water quality result into a specific determination of safety.
The majority of hobbyists read total number and think they understand the threat posed by it; however, all threats depends wholly upon the temperature and pH of the water. This is where most folks mess up. Small changes to your tank conditions cause dramatic shifts in the split between these two forms. A drop in temperature pulls the ammonia back towards safe ionic form. An increase in pH pulls it closer to becoming that nasty, toxic gaseous state. Biological safety are a balance and water chemistry determine what happens.
Why Fish Suffer From Ammonia Gas
This calculator on the page solve the equilibrium equations for you so you don’t have to guess when converting total ammonia into actionable data. All you have to do is know your current parameters to see which form dominates. It is more important to know what system you’re running than to know generic numbers. Just as a 1ppm ammonia level means something different in a softwater planted tank vs. A hardwater cichlid display, it also differ depending on other water parameters (e.g., salinity, ionic strength). Since these do affect how ammonia spreads itself, there is presets for many types of systems within the tool.
Because of large amount of salt found in marine aquariums, ammonia partitioning favors the non-toxic fraction somewhat more than in fresh water with similar pH values, but not by much. For an accurate assessment instead of just an approximation, add your individual profile. This depends upon change in pKa with temperature and it’s a simple equation. Basically warmer water is less safe because it makes ammonia more volatile. If you assume that both tanks are set to the same pH, then an 86 degree tank will contain a much greater amount of poisonous gas than a sixty-eight-degree tank. That’s what causes those summer ammonia spikes outdoors, which are often worse than winter spikes. The calculator accounts for this temperature variation automaticly as well.
Additionally, if your lab report reports mass per nitrogen rather than mass per molecule, like many do, it will convert units for you. This prevents you from multiplying by the wrong coefficient, which throw everything off. Dilution (water changes) works, too. But be careful: the dilution also change things like the temperature and the pH, both of which could accidentalaly increase the ammonia fraction as well. If you use tap water for the replacement water with a different pH, then maybe it decrease the total nitrogen load while increasing the fraction of the toxic gas. Sounds counterintuitive? Look at the ratios. The tool models such a mix situation and allow you to predict what will happen before doing the water change. Can you verify if your maintenance plan really improves safety, or if it just shifts the risks around?
Personalizing charts: Charts and reference tables is good for general guidelines, but not personalized. The chart that says pH eight point five kills is useless if you have a tank that’s seventy-two degrees and has low alkalinity. Water chemistry in the real world isn’t black and white. Even though your test say the water’s okay on paper, you see your fish gasping at the top of the tank. Often, that means there was an undetected pH shift. It could also mean a temperature increase spike un-ionized gases that aren’t being measured. Finding those subtle changes can save fish.
Don’t count on any one measurement as a long term indicator of tank health, Biological activities and feeding schedules causes ammonia levels to change daily. Instead, test consistently and look for trends (not each individual data point). Consider calculated threshold values as “planning” guidelines, they aren’t absolutes. Plan for bacterial colony growth by reducing feedings and boosting aeration if you find yourself hovering around the danger zone(s). The perfect should of been the enemy of the good.
You don’t need to remove all ammonia. It’s more a matter of controlling the portion that’s harmful without killing your fish. While they can tolerate some, stress deplete their tolerance rapidly. Understanding the relationship between these two variables (the ratio), lets you exert some control over something test strips hide. Instead of wondering if your water is okay, you know precisely where the line is. This will change regular upkeep from a burden into a precise activity. The figures point you in the right direction while observing the fish validates your results.