Free Ammonia From Total Ammonia Calculator
Estimate un-ionized NH3 from total ammonia, pH, temperature, salinity, test kit reading type, water volume, dilution, and a target threshold.
Free ammonia estimate
Results update from total ammonia, reading type, pH, temperature, salinity, tank volume, dilution, and threshold.
Trace
Below 0.005 mg/L NH3. Often used as a low planning zone for routine comparison.
Watch
0.005-0.020 mg/L NH3. Recheck pH, temperature, kit type, and trend direction.
Elevated
0.020-0.050 mg/L NH3. The entered threshold may be exceeded in alkaline or warm water.
High
Above 0.050 mg/L NH3. Treat the number as a strong chemistry warning and verify readings.
| pH | 68°F / 20°C | 77°F / 25°C | 86°F / 30°C | How to use |
|---|---|---|---|---|
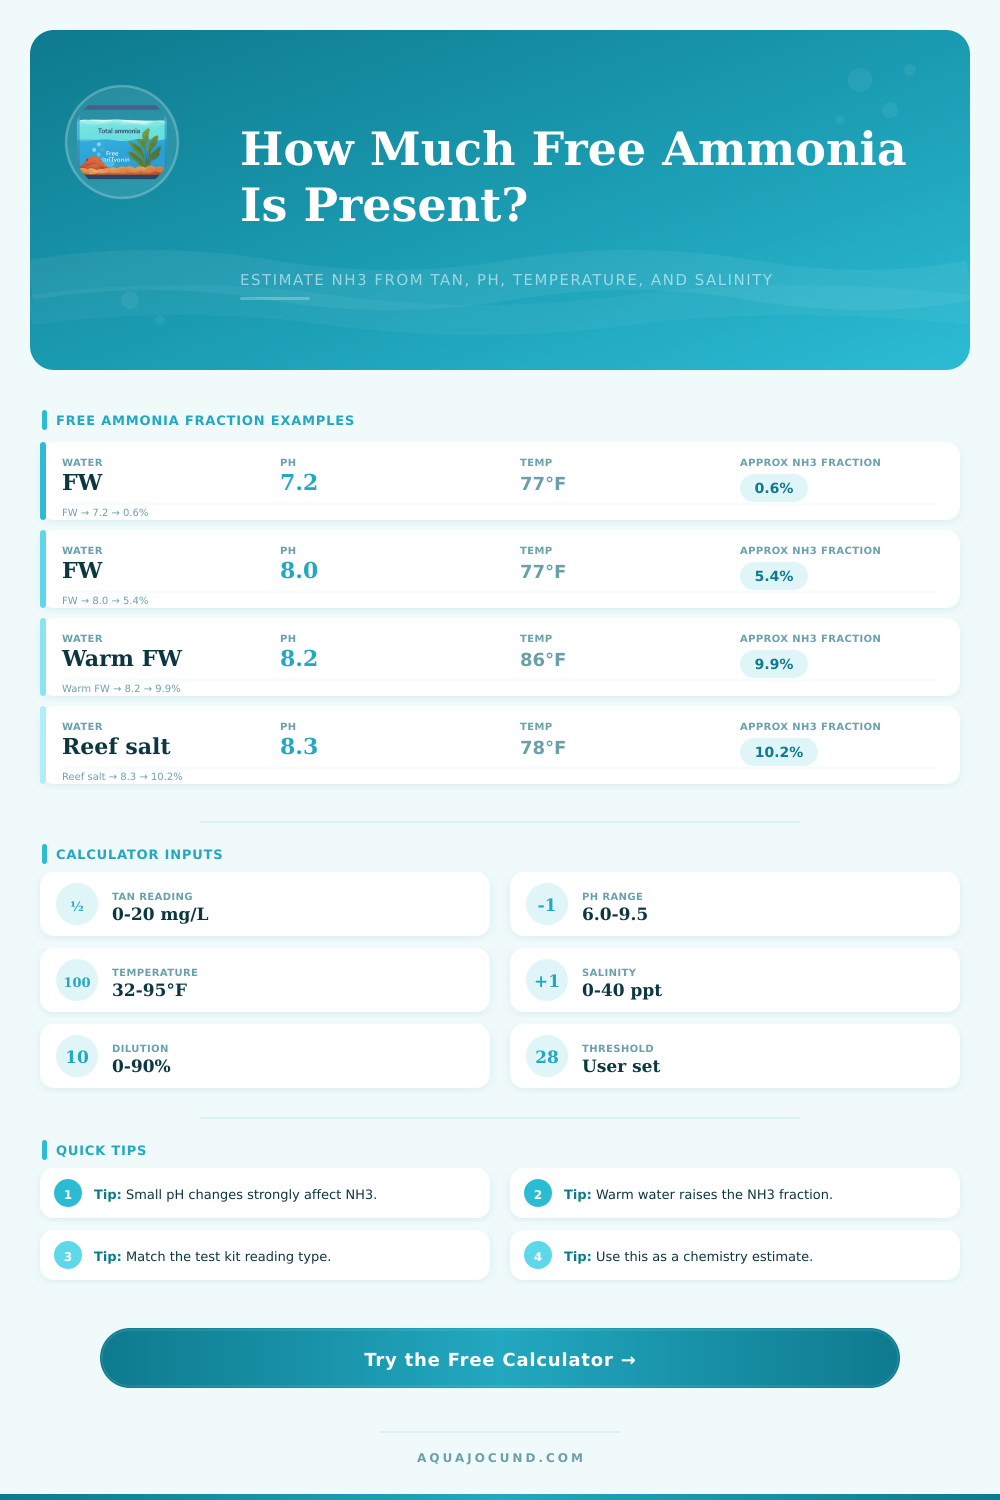
| 7.0 | 0.4% | 0.6% | 0.8% | Acidic freshwater keeps most ammonia as NH4+. |
| 7.5 | 1.2% | 1.8% | 2.5% | Small TAN readings can still produce measurable NH3. |
| 8.0 | 3.8% | 5.4% | 7.5% | Common alkaline freshwater stress test zone. |
| 8.3 | 7.3% | 10.2% | 13.8% | Marine and hard-water systems need careful reading type checks. |
| 8.6 | 13.4% | 18.3% | 24.1% | High pH magnifies free ammonia quickly. |
| Reading type | Calculator conversion | Output basis | Notes |
|---|---|---|---|
| TAN as nitrogen, NH3-N / NH4-N | Input mg/L N x 1.216 = total ammonia as NH3 equivalent | NH3 mg/L and NH3-N mg/L | Common for lab-style nitrogen reporting and many water-quality tables. |
| Total ammonia as NH3 / NH4+ | Input is treated as total ammonia expressed as NH3 equivalent | NH3 mg/L and NH3-N mg/L | Use when the kit says total ammonia, ammonia, or NH3/NH4+ as mg/L. |
| Already free NH3 reading | Input is treated as un-ionized NH3 directly | NH3 mg/L only checked against threshold | Useful for meters or calculated free-ammonia cards. |
| Replacement water TAN | Same reading type as the main test kit reading | Mixed after dilution percent | Enter 0 when new water has no measurable total ammonia. |
| Scenario | Typical volume | Common pH / temp | Free ammonia planning note |
|---|---|---|---|
| Nano freshwater | 10 gal / 38 L | 7.4 / 76°F | Small volume means low total ammonia mass, but readings can change quickly. |
| Community aquarium | 55 gal / 208 L | 7.6-7.9 / 76-78°F | Moderate pH keeps the NH3 fraction lower than hard alkaline water. |
| Goldfish aquarium | 40-75 gal / 151-284 L | 7.8-8.2 / 70-76°F | Higher waste load makes TAN trend checks important. |
| Brackish aquarium | 30-75 gal / 114-284 L | 7.8-8.3 / 76-80°F | Salinity and alkaline pH should be entered together. |
| Reef aquarium | 75-125 gal / 284-473 L | 8.1-8.4 / 77-80°F | High pH makes the NH3 fraction larger even when TAN is modest. |
| Koi pond | 1000 gal / 3785 L | 7.8-8.5 / seasonal | Large water volume can contain a large total NH3 mass at the same mg/L. |
| Water change | New water TAN | Approx TAN left | Calculator use |
|---|---|---|---|
| 25% | 0 mg/L | 75% of original TAN | Small dilution check for mild readings. |
| 50% | 0 mg/L | 50% of original TAN | Common projection point used by the preset buttons. |
| 75% | 0 mg/L | 25% of original TAN | Large dilution projection; match temperature and pH assumptions separately. |
| 50% | 0.25 mg/L | 50% original plus 50% source TAN | Use when tap, well, or mixed water has a measurable reading. |
Your heart relaxes when you read a clean zero from the test kit. You feed the fish, but one of them die with no apparent cause. That’s another trap for new aquarist.
Most test kits only measure total ammonia. Total ammonia consist of two forms: toxic free form (uncharged) ammonia and non-toxic charged ammonium. Based off your water conditions, the calculator above will separate the two for you. Knowing this difference mean knowing how to keep your tank healthy.
Why Total Ammonia Tests Can Be Wrong
PH is critical for the chemistry. It controls how ammonia balance and changes depending on whether the water is alkaline or acidic. The higher your pH then the more of your total ammonia will become un-ionized NH3. That’s the nasty stuff that cross gill membrane and does the damage. So a slight pH change may look like nothing on a color chart visually, but it doubles the actualy toxicity. And people mess up here. They rely on the number they see on their color chart without wondering which portion of that number is really toxic.
What percent of total is dangerous? Temperature also affects this. Even if pH remain constant, warmer water increase the chance of more free ammonia regardless. The additional variable here is salinity. It affect the dissociation process because salinity contains ions that also affects the process. Marine systems naturaly suppress some free ammonia vs freshwater at the same pH, but they also operate at higher baseline pH levels which pushes the fraction up again. So there is no one rule of thumb and you would of to weight these two factors against one another.
Fortunately, the author of this page has done that for you. They put together a reference table that shows how variables work together based on temperature range, so you can see the trend before you freak out. The type of reading is very important (e.g., input ammonia as Nitrogen or Total Ammonia Mass). Some tests report ammonia as one and some test kits reports the other. Confusing these will result in a 20% or greater difference in calculated toxicity.
The tool automates this if you choose the appropriate preset based on tank style. Does your tank have hard alkaline water like a reef? Or do you use soft acidic freshwater? Your water’s starting point need to match what the tool assumes. For example, a big pond has a different reaction time to change than a nano tank. Knowing the volume help put the total mass of toxins in the water into context.
A practical application is that dilutions helps you calculate out a water change. Rather than guess at what amount of water you should add to reach an “OK” level of ammonia, you can plug in your existing numbers, plug in number of gallons being replaced with new water, and figure it out. You will no longer under treat or over treat.
You don’t have to worry if everything is fine anymore because you know exactly where it stands on the scale of being okay. It goes from anxiety to data. It’s important for many hobbyists to understand the lag time between feeding and testing. For example, if you’re testing an outdoor pond where water temps fluctuate with the seasons, it’s common to see ammonia spikes following a big feed.
By testing randomly, you get erratic readings, which result in bad decisions. This is why consistency matters. Test once per week, under similar circumstances. Make sure to test at roughly the same time as well. Don’t fret over one low result. Pay attention to the trend. You want to stabilize your tank, not make it perfect.
Chemistry is how you save the day when things go sideways. That’s when you get back to basics. The real story is told in pH, temperature, and total ammonia. And although free ammonia is invisible, we can calculates it. Then we know what’s dangerous so we can make that danger visible and manage it.
Chemistry gets us control back because all too often the hobby seem governed by luck. It helps you read the water itself, eventually. You start noticing how clear it is. You notice how your livestock behaves. You see the water itself before you even pick up the reagent bottle.