CO2 mL Per Minute Calculator
Estimate aquarium CO2 gas flow, calibrated bubble rate, daily injected volume, ppm effect, pressure fit, diffuser loss, and degassing impact.
CO2 injection snapshot
Results combine gas flow, bubble calibration, diffuser efficiency, injection window, pressure, and degassing.
Calculation breakdown
0.5 mL/min
Gentle nano flow. About 30 mL gas per hour before diffuser loss.
1.5 mL/min
Common 20 gallon starting point. About 90 mL gas per hour.
4.0 mL/min
Moderate 55 gallon injection. About 240 mL gas per hour.
8.0 mL/min
Large or high-light systems. Needs stable pressure and diffusion.
15 bpm
At 15 bubbles/mL this equals 1.0 mL/min gas flow.
45 bpm
At 15 bubbles/mL this equals 3.0 mL/min gas flow.
90 bpm
At 15 bubbles/mL this equals 6.0 mL/min gas flow.
150 bpm
At 15 bubbles/mL this equals 10.0 mL/min gas flow.
| Diffuser type | Typical gas loss | Useful pressure range | Calculation note |
|---|---|---|---|
| Ceramic disc diffuser | 18-35% | 20-40 psi | Good mist, but placement and cleaning change the loss quickly. |
| Inline atomizer | 10-25% | 30-45 psi | Needs higher pressure, usually strong dissolution after the filter. |
| External reactor | 3-12% | 10-25 psi | Highest capture when flow is steady and the chamber is not gas locked. |
| CO2 ladder | 25-45% | 8-20 psi | Low pressure, slower response, visible bubble path. |
| Passive bell | 35-60% | 5-15 psi | Useful for low energy tanks, not precise for fast ppm ramps. |
| Powerhead mist | 15-35% | 12-30 psi | Distribution is strong, but undissolved mist can reach the surface. |
| Limewood stone | 25-50% | 8-20 psi | Fine bubbles at first, then variable as wood ages and clogs. |
| Tank size | Net volume | Moderate mL/min | At 15 bubbles/mL |
|---|---|---|---|
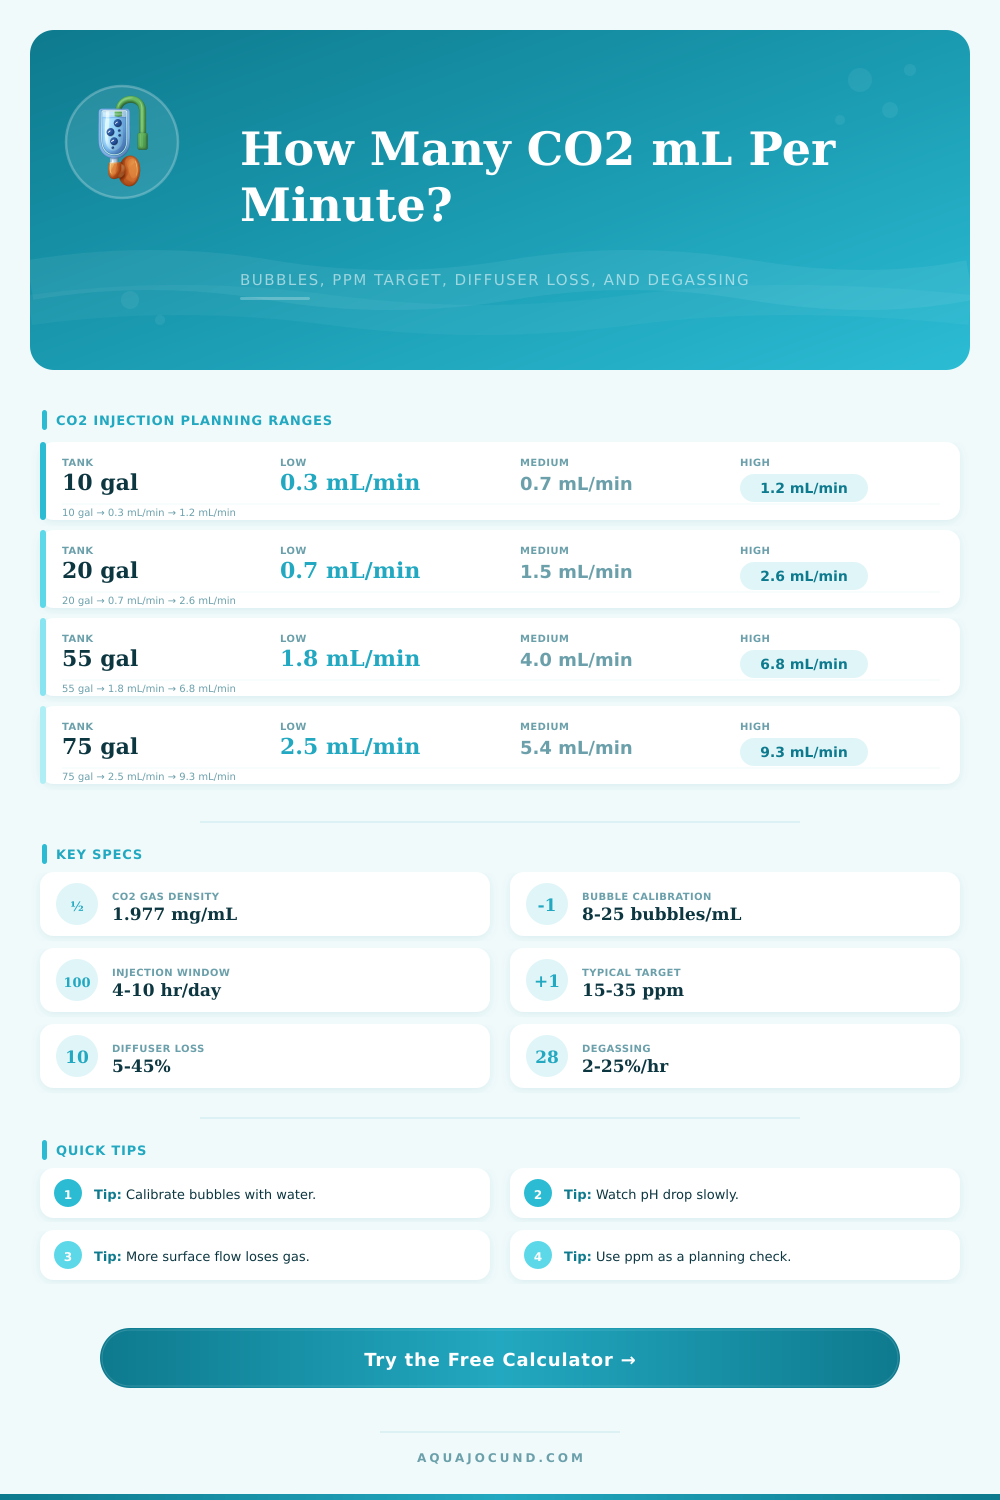
| 10 gallon nano | 8.5-9.5 gal / 32-36 L | 0.4-1.2 mL/min | 6-18 bubbles/min |
| 20 gallon long | 17-19 gal / 64-72 L | 0.9-2.5 mL/min | 14-38 bubbles/min |
| 29 gallon planted | 24-27 gal / 91-102 L | 1.3-3.6 mL/min | 20-54 bubbles/min |
| 40 breeder | 34-37 gal / 129-140 L | 1.8-5.0 mL/min | 27-75 bubbles/min |
| 55 gallon display | 47-51 gal / 178-193 L | 2.5-6.8 mL/min | 38-102 bubbles/min |
| 75 gallon high tech | 64-69 gal / 242-261 L | 3.4-9.2 mL/min | 51-138 bubbles/min |
| 125 gallon display | 108-116 gal / 409-439 L | 5.7-15.5 mL/min | 86-233 bubbles/min |
| Degassing setting | Likely setup | Effect on mL/min | Use when |
|---|---|---|---|
| 2-5% per hour | Calm surface, covered tank | Lower flow reaches target | Minimal ripple and no sump waterfall. |
| 6-10% per hour | Normal planted tank ripple | Moderate correction | Typical lily pipe or gentle return movement. |
| 11-18% per hour | Strong surface exchange | Higher flow needed | Spray bars, skimmers, or open top with visible chop. |
| 19-30% per hour | Heavy aeration or sump splash | Much higher flow needed | Wet/dry overflow, air stones during injection, or very turbulent returns. |
| Check | Low sign | High sign | Adjustment |
|---|---|---|---|
| Working pressure | Diffuser stalls or bubbles surge | Needle valve is touchy | Match pressure to diffuser range before changing ppm target. |
| Bubble calibration | Large bubbles mean fewer bubbles per mL | Tiny bubbles mean more bubbles per mL | Calibrate the actual counter, not a generic online value. |
| Ramp timing | Target not reached by lights on | Fast early pH drop | Use the pre-light start setting and reduce sudden jumps. |
| Diffuser cleanliness | Larger bubbles and poor mist | Fresh cleaning restores flow | Recheck bubble rate after cleaning or replacing ceramic media. |
The bubble counter is intriguing but also slightly suspect. With one click of the device, everything look fine. With the next tick, there might be to few bubbles. Or perhaps they are merely blowing unused gas in the atmosphere. Understanding how many bubbles are realy being produced is important because it turns what would otherwise be guesswork into something you can plan and control.
Simply counting bubbles per minute (BPM) are the obvious beginning for most hobbyists; it’s instantaneous and you can see it happening. Trouble is, bubble size depend hugely on the internal shape of the chamber, the viscosity of whatever liquid is inside it, and the viscosity of that liquid itself. Big bubbles at a high rate may produce fewer volume units of carbon dioxide then small micro-bubbles produced slowly.
How to Get Your CO2 Right
By entering your own calibration, the calculator does the work. You won’t need to depend on the average values pulled from some random internet search which will probably not apply to your configuration. But then again, you have to realize once that gas exits the regulator, things gets really interesting. It is hard to make carbon dioxide dissolve efficient because it is heavy. Then you factor in which kind of diffuser you are using, as all diffusers has unique efficiency curves.
While an inline atomizer may hold pressure well, it can takes greater psi settings in order to do so effectively. A ceramic disc gives off that great mist you can see but frequently loses upwards of twenty percent or more of the gas prior to dissolving. With a basic ladder or a passive bell, the loss rate skyrockets even further. Enter that number into the tool and you’ll know how much actual gas makes it to your water column. It’s more than forcing more gas through the line, it’s about catching what you’re sending down there.
One of the biggest hurdles for high tech planted tanks are degassing. Everything you do to agitate the surface of the water will work against you when you try to inject co2. Strong return currents, overflow weirs, and spray bars all remove carbon dioxide from the water faster than you can add it. That’s why you can use the same equipment in two tanks and one will go well and one won’t, but both are identical tanks. In one tank, there may be no surface ripple or disturbance at all so the gas stays dissolved. In another tank, maybe the flow is so aggressive that it constantly off-gasses the CO2.
Try to get an idea for how quickly your tank is losing gas per hour visually. If you notice lots of white water and constant chop on the tanks surface, then assume you’re degassing quite a bit. The more you adjust that input, the more you change the whole equation. That adjustment determines how much excess gas you must inject to simply break even.
One aspect of this that gets overlooked until something goes awry is pressure stability. The working pressure from your regulator should be constant and matched to what your diffuser requires. Without maintaining stable pressure, all those numbers on bubble count mean nothing. What may appear to be an increase in injection rate are really a spike in the pressure forcing more un-dissolved gas to come out quicker. Maintaining stable pressure makes those mL per minute figures accurate and consistent for long-term use. That means you can make gradual adjustments as needed instead of swinging way up and down from not enough to too much.
The ultimate feedback loop is plant health. No calculation will tell you what it tells you. What ppm do you want? High lights? It is typically 20-30 parts per million, but those numbers are just a guide. A means of planning. The feedback comes from the plants. Are they growing fast? Is their color bright? Those are indicators you have things about right. Melting leaves? Are there algae blooms? Something isn’t quite right with that fine line. So start low, ramp up slowly and be looking for indicators of stress on both sides of the equation. Plants tend to handle slow deficits better than fish handles an abrupt spike.
Finding the sweet spot isn’t an exact science. There are too many variables that change over time. Your CO2 equipment will age. Your substrate temperature will vary. Plant growth will also vary seasonally. In short, finding the right number is more about tuning for variables. Your first equation is just where you begin from. Next, you watch, you tweak, you adjust. Stability, not perfection is the name of the game.
Then, once you’ve learned the relationship between diffused and generated gas and pressure and degassing, you’re no longer mystified by the bubble counter. Instead, it joins a list of other gauges you use while creating a healthy underwater world. You don’t stare at those bubbles anymore; you stare at the plants.