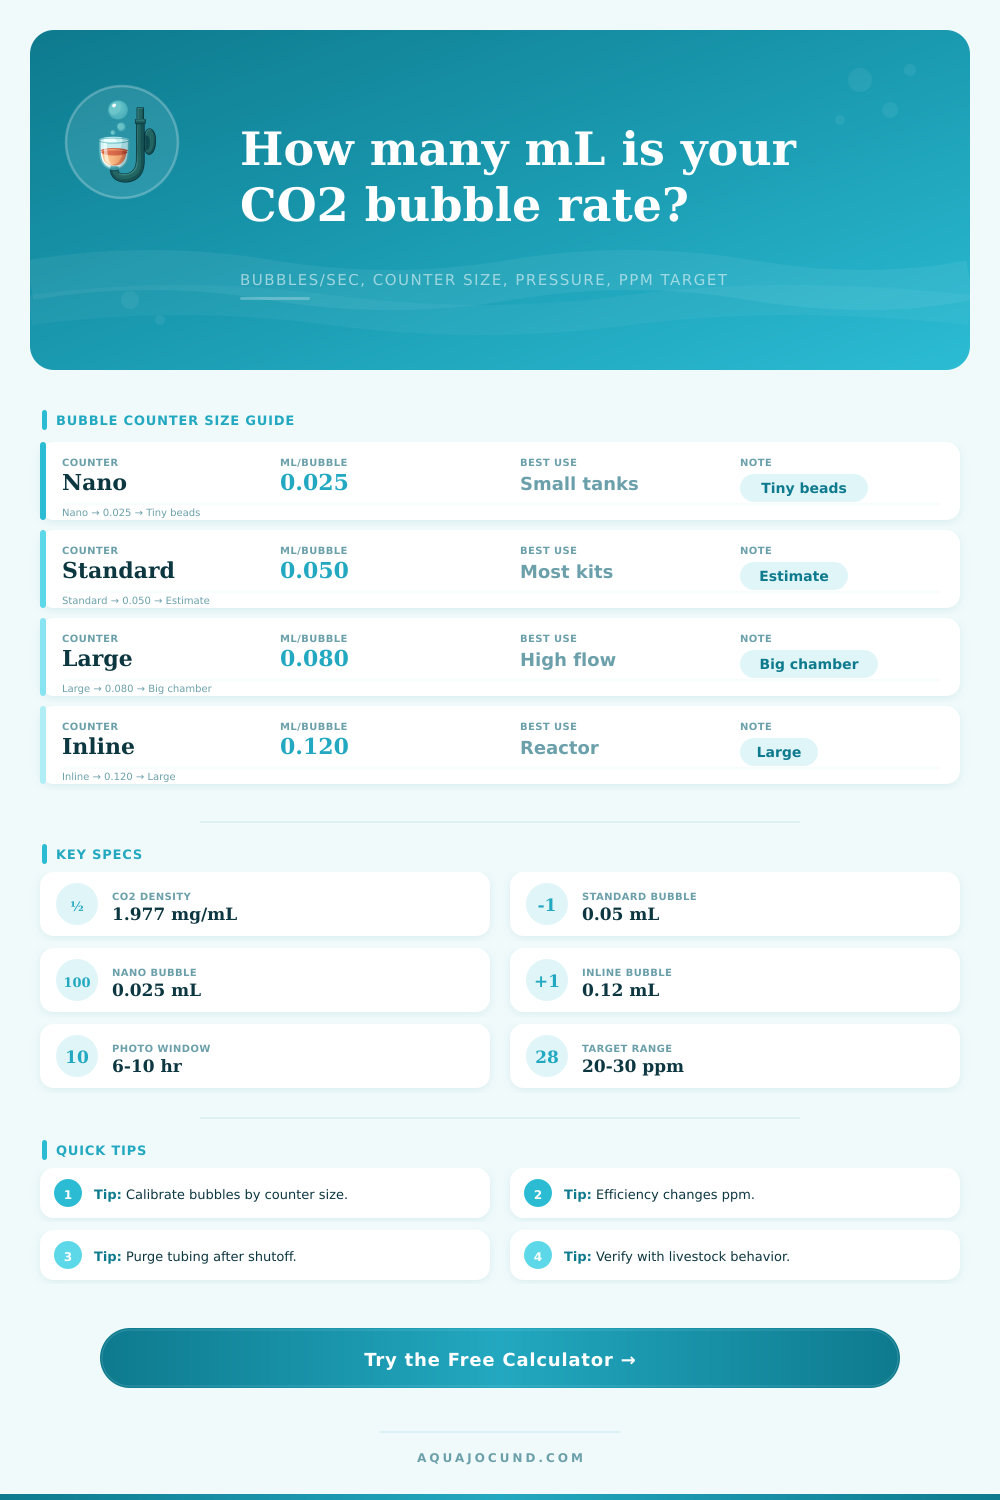
CO2 Bubble Per Second to mL Calculator
Convert aquarium CO2 bubble rate into gas volume, dissolved dose, daily ppm estimate, tubing purge, and target bubble rate.
⚙CO2 setup presets
💧Bubble rate and aquarium inputs
🧪Bubble size comparison grid
📊Bubble counter reference
| Counter type | Typical mL/bubble | 1 bubble/sec before pressure | Best calculator use |
|---|---|---|---|
| Nano glass counter | 0.025 mL | 90 mL/hr | Small planted tanks and careful starts |
| Mini inline counter | 0.035 mL | 126 mL/hr | Compact regulators and small canisters |
| Standard bubble counter | 0.050 mL | 180 mL/hr | Default comparison for many hobby kits |
| Ceramic diffuser counter | 0.060 mL | 216 mL/hr | Visible counter built into diffuser line |
| Large chamber counter | 0.080 mL | 288 mL/hr | Bigger water chamber bubbles |
| CO2 ladder large beads | 0.100 mL | 360 mL/hr | Slow visible ladder beads |
| Inline reactor counter | 0.120 mL | 432 mL/hr | Large pockets before reactor intake |
⚗Diffuser efficiency reference
| Diffuser type | Typical efficiency | Pressure note | Calculator note |
|---|---|---|---|
| Small ceramic disc | 55-75% | Often 15-30 psi | Good default for in-tank mist |
| Inline atomizer | 65-85% | Often 25-45 psi | Fine mist, some line loss |
| External reactor | 85-98% | Moderate to high flow | Highest dissolved estimate |
| CO2 ladder | 45-65% | Low pressure | Large bubbles dissolve while climbing |
| Powerhead mist | 60-80% | Depends on chop and flow | Fine mist but more surface escape |
| Bell or cup diffuser | 30-55% | Low pressure | Slow contact, useful for gentle setups |
🐟Common planted tank examples
| Tank | Volume | Typical bubble range | Target estimate |
|---|---|---|---|
| 5 gal nano | 19 L | 0.2-0.6 bps | 15-25 ppm with caution |
| 10 gal planted | 38 L | 0.5-1.2 bps | 20-30 ppm |
| 20 long | 76 L | 1.0-2.5 bps | 20-30 ppm |
| 40 breeder | 151 L | 2.0-5.0 bps | 20-35 ppm for carpets |
| 75 gal display | 284 L | 4.0-9.0 bps | 20-30 ppm with good circulation |
| 120 gal aquascape | 454 L | 6.0-14.0 bps | Use pH trend and reactor data |
🔧Tubing and pressure reference
| Item | Typical value | Calculator effect | Why it matters |
|---|---|---|---|
| 4/6 mm CO2 tubing ID | 4 mm / 0.157 in | 12.4 mL per meter | Line volume purges after shutoff |
| Standard aquarium airline ID | 4.8 mm / 0.187 in | 18.1 mL per meter | More gas held in the line |
| Ceramic diffuser pressure | 15-30 psi | Raises gas moles per visible bubble | Bubble counter is under line pressure |
| Inline atomizer pressure | 25-45 psi | Higher pressure correction | Smaller mist but more compressed gas |
| Open top surface loss | 5-15%/hr | Lowers retained ppm | Agitation strips CO2 during dosing |
You can get a good sense for your tank’s pulse by watching CO2 bubbles ascend in a glass counter. A single bubble/second seem swift; two feels like a rush. But this is just a small portion of all the chemical being delivered into the tank.
Here’s the issue: a bubble isn’t a constant unit of measurement. It depends on line pressure, type of counter used and even temperature of the gas itself. This means visual estimation commonly result in either overdosing or wasting valuable CO2.
Why Bubble Counting Is Not Enough
You simply enter what type of set-up you are running and it do the rest of the math (see calculator above). You no longer have to guess at actual volume that your bubbles occupy. Many hobbyists think all bubbles is the same size. They aren’t. A bead might hold only 0.025 mL of gas if produced by a nano counter. Inline reactor counters can pushes pockets with volumes up to 0.120 mL. That’s a five-fold difference and it alters your dosing strategy entireley. Treat them equally and you’ll either waste half of your cylinder within the month or starve your plants.
By allowing you to pick your specific counter type, it take physical differences into account and converts the rhythm you see into a measurable volume.
Another interesting factor that should surprise no one is pressure. Those bubbles you see has gas in them and when they’re compressed by setting your regulator to 25 psi, the volume of that gas decrease (i.e., it gets smaller), which increases its mass (it becomes heavier). So now you’ve got a little ball of extra gas that is heavier then it was at atmospheric pressure. It is a little thing that makes a big difference when you’re trying to be precise.
If you don’t account for the compressibility of the gas, your expected daily delivery amount will be far less than what you’ll actualy be putting out. By simply plugging in your working pressure, the calculator does the math for you so you can have better idea of how much you’re really putting into water column.
There’s also a variable called diffuser efficiency. Not all of the gas released by ceramic disc gets absorbed. Some of it goes right into air and some of it dissolves into the water. So there are losses with any diffuser. Generally, reactors will be more efficient than a simple disc. But if there is surface agitation, dissolved CO2 can get stripped back out before reaching roots. These losses are factored in the tool, because you’re not simply measuring output. You’re trying to estimate actual retention. You input your diffuser type and its efficiency rating and the system tweaks the final ppm estimate accordingly… How much stays in the tank vs. This shows how much vents out into the room.
The hidden problem with startup cycles is the tubing volume. Any CO2 sitting in your airline tubing when the solenoid shuts off at night are gone forever. This waste accumulates fast if you have long lines with large internal diameters. With the calculator, you can enter the tubing diameter and length and it will tell you how much gas is lost from each purge cycle. Before you empty another tank, this is a practical way to see if your layout is inefficient.
To conclude. Numbers are only guidance, however. What matters most is what your livestock tell you. If you have gasping fish at the surface, it’s too high in CO2. If you’re seeing algae blooms even with strong lights, it’s probably because there isn’t enough. Base the calculation on the ppm and then adjust accordingly through biofeedback from your livestock. While the ppm calculator provide the science behind it, the health of your fish and plants will ultimately be the answer.
Think of this calculator as a compass, not a map. Avoid the all-too-common mistake of guessing, and you’ll never look back at those increasing bubbles as mere decoration again. Instead, they’ll become a measurable asset that sustains the life within your tank.