Fish-In Cycle Water Change Calculator
Estimate water change size, rebound before the next change, and retest timing from ammonia, nitrite, source water, livestock load, and daily production.
🧪Fish-In Cycle Presets
⚖Cycle Water Change Inputs
Use water actually in the tank after substrate, decor, and filter volume.
Profile fills typical daily ammonia and nitrite rise; edit values if your tests show a different trend.
Use the product label window as a retest planner. This calculator still treats measured ppm as present.
📊Current Routine Benchmarks
🔄Cycling Stage Comparison Grid
Early Ammonia
Ammonia is rising while nitrite is still low or absent.
Watch: TAN trendMixed Spike
Both tests show readings, so the larger required change controls.
Watch: both ppmNitrite Spike
Ammonia may fall while nitrite becomes the main limit.
Watch: NO2 reboundLate Cycle
Trace readings clear faster, but source water and feeding still matter.
Watch: stability🐟Livestock Load Reference
| Load Profile | Typical Ammonia Rise | Typical Nitrite Rise | Best Calculator Use |
|---|---|---|---|
| Very light load | 0.10 ppm/day | 0.05 ppm/day | Single small fish or sparse temporary stocking |
| Light community | 0.20 ppm/day | 0.12 ppm/day | Careful feeding with modest stocking |
| Average community | 0.35 ppm/day | 0.25 ppm/day | Typical fish-in cycle estimate |
| Heavy community | 0.55 ppm/day | 0.42 ppm/day | Dense stocking or generous feeding |
| Goldfish / messy fish | 0.80 ppm/day | 0.60 ppm/day | Large waste load and frequent changes |
| Fry or feeding-heavy | 0.70 ppm/day | 0.55 ppm/day | Small foods, frequent feeding, grow-out tanks |
💧Common Tank Water Change Volumes
| Nominal Tank | Approx Actual Volume | 30% Change | 50% Change | 70% Change |
|---|---|---|---|---|
| 5 gal / 19 L | 4.5 gal / 17 L | 1.4 gal / 5 L | 2.3 gal / 9 L | 3.2 gal / 12 L |
| 10 gal / 38 L | 9 gal / 34 L | 2.7 gal / 10 L | 4.5 gal / 17 L | 6.3 gal / 24 L |
| 20 long / 76 L | 18 gal / 68 L | 5.4 gal / 20 L | 9 gal / 34 L | 12.6 gal / 48 L |
| 29 gal / 110 L | 26 gal / 98 L | 7.8 gal / 30 L | 13 gal / 49 L | 18.2 gal / 69 L |
| 40 breeder / 151 L | 36 gal / 136 L | 10.8 gal / 41 L | 18 gal / 68 L | 25.2 gal / 95 L |
| 55 gal / 208 L | 50 gal / 189 L | 15 gal / 57 L | 25 gal / 95 L | 35 gal / 132 L |
| 75 gal / 284 L | 68 gal / 257 L | 20.4 gal / 77 L | 34 gal / 129 L | 47.6 gal / 180 L |
| 125 gal / 473 L | 115 gal / 435 L | 34.5 gal / 131 L | 57.5 gal / 218 L | 80.5 gal / 305 L |
⏱Water Change Frequency Examples
| Routine | Daily Production Fit | Stability | Tradeoff |
|---|---|---|---|
| 25% every 24 hours | Very light to light | Gentle but limited dilution | May not lower high readings quickly |
| 50% every 24 hours | Average fish-in cycle | Strong daily reset | Requires matched temperature and conditioner |
| 30% every 12 hours | Moderate rise | Smoother than one large change | More maintenance sessions |
| 70% every 24 hours | Heavy load or spike | Fast dilution | Large chemistry swings if source water differs |
| 15% automatic daily | Late cycle traces | Very smooth | Not enough for active spikes |
🧪Source Water And Test Reading Notes
| Source Reading | Calculator Effect | What It Means | Planning Caution |
|---|---|---|---|
| 0 ppm ammonia, 0 ppm nitrite | Lowest dilution floor | Water changes can move readings close to zero | Rebound still depends on livestock load |
| Tap ammonia present | Raises post-change ammonia | Chloramine-treated tap can read as TAN | Enter the measured source value |
| Tap nitrite present | Raises post-change nitrite | Replacement water sets a limit | Target cannot be below source without different water |
| Different pH or temperature | Not modeled here | Dilution math still works in ppm | Match water before large changes when possible |
| Detoxifier window | Schedules retesting | It does not erase the measured nitrogen mass | Retest after mixing and again before the window ends |
Setting up a new tank and cycling it while it contains fish is more akin to emergency medicine than husbandry. Your goal is to have your beneficial bacteria grow up enough to remove toxins they make so it doesn’t harm them…or you. At the same time, you’re attempting to reduce ammonia and nitrite concentrations just below what your livestock can tolerate. It’s a delicate balance between chemistry and timing.
When most hobbyists do this, they’re guessing at how much water to change based off test results they don’t like. Then they panic, pull the plug, and dump out half the tank. This works some of the time, but it also cause extra stress to fish and upends the biological filter you’re struggling to establish.
Use Math for Safe Water Changes
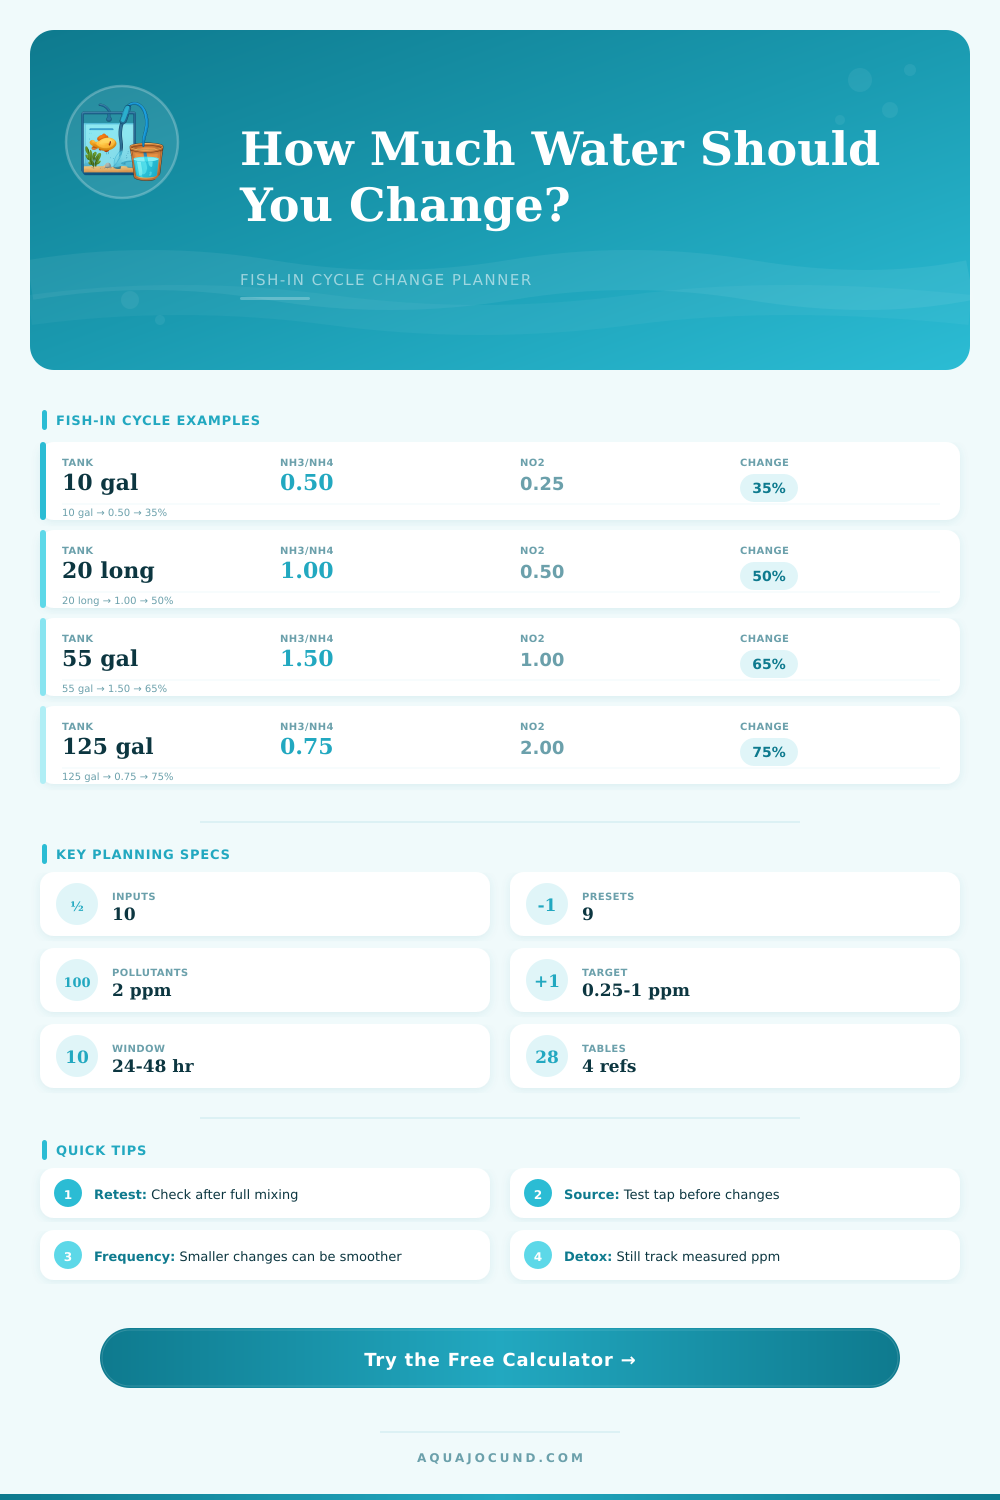
Plug your tank’s volume and existing pollutants into calculator above. It will show you the dilution percentage needed to reduce compounds to your desired level. It does all math so you don’t have to guess how little/much difference it makes. It’ll tell you exactly by what percentage you must dilute to reach your desired safe level.
Simply enter your real water volume (i.e., not the nominal size written on the glass). Subtract these things: the filter media, any decor/substrate, etc. This will reveal your true volume. For example, a twenty gallon long isn’t a twenty gallons of water… Not anymore. Entering the real value ensures you won’t overestimate your dilution power.
If you believe you’re knocking out 50% of your ammonia but are really only taking out 40% due to unseen displacement, your ammonia will rebound sooner then expected. And that’s where people make mistakes. They assume their source water is the problem but it’s because they didn’t account for their tank’s true volume.
Knowing how quickly you produce also affects your maintenance planning. A heavy feeder or a messy goldfish produces waste differently than a solitary betta. A lone betta doesn’t produce as much waste as fish in a community tank. With the tool, you choose a load profile based on the type of livestock you have. That determines the level of toxicity predicted between each change.
If it takes two days for your ammonia to rise from zero to one part per million, then your daily production is about half a part per million. Plug that into the equation and it predicts whether a big change once every day and a half will hold peak levels below toxic values. Or do you need multiple smaller changes? Size does matter.
Consistent exposure allows the bacteria colony to grow. Big changes in concentration can shocks both the colony and the fish. What’s possible? That depends on the quality of the source water. How much can you change with a new filter if your tap water has chloramine in it and therefore contains some trace level of ammonia? Nothing until you treat or add more filters.
The calculator uses source readings to predict what the water will be like after changes. It won’t lie and tell you to just dilute away your issue because it can’t… It factors source readings into post-change guess. Sometimes you’ll have to use a detoxifier to fill in the void while you wait for test cycles, but even so, there’s still waste sitting there in the tank. Detoxifiers provide time. They don’t eliminate waste. Retest based on the time listed on product label to help ensure you detect any rebound before it’s too late.
On the page, there’s a reference table that outlines normal load profiles in case you’re not sure what category your set up falls under. Average is for most community tanks; quarantine or fry tanks typically fall at high end of the scale. To avoid underestimating waste load, make sure you match your profile to reality. Don’t assume more than your tank can stand, because it’s always better to play safe when making adjustments.
This applies to water changes (dilution ratios) and also to the critical cycling period, when bacteria convert waste faster then they can multiply. Speed kills; well actualy, it’s stability that really does. Multiple smaller changes create slower changing chemical gradients compared to one giant drain of the tank each week. Sudden (big) changes in pH or temperature is far harder on your fish than gradual (smaller) ones.
Use the expected peaks for various routines to see where the sweet spot is… How often do you need to drain your tank so that ammonia never spikes past what you see as acceptable? It may be once a day, or maybe it’s twice a week. All depends on your source water quality and your production rate. One size doesn’t fit all. It only depends on what the math tells you about your particular system.
The spikes cease eventually. The bacterial colony finally catches up with the waste load. Ammonia and nitrite decreases to unmeasurable amounts. And that is our goal. Until then, however, guesswork gives way to careful planning. You control the chemistry instead of simply reacting to it. Luck had nothing to do with it, the fish survived because you knew the mathematics of water.
Monitor those trends. Change your inputs to match where the cycle is at. Let the numbers guide you until the tank finds its own balance.