Planted Tank EI Reset Water Change Calculator
Estimate weekly EI totals, plant uptake, source-water carryover, and the nutrient range left after your reset water change.
⚙ Units and Presets
📏 Tank, Reset, and Target Profile
🧪 Weekly EI Dosing Totals and Uptake
💧 Residual and Source Water Nutrients
📊 EI Reset Comparison Grid
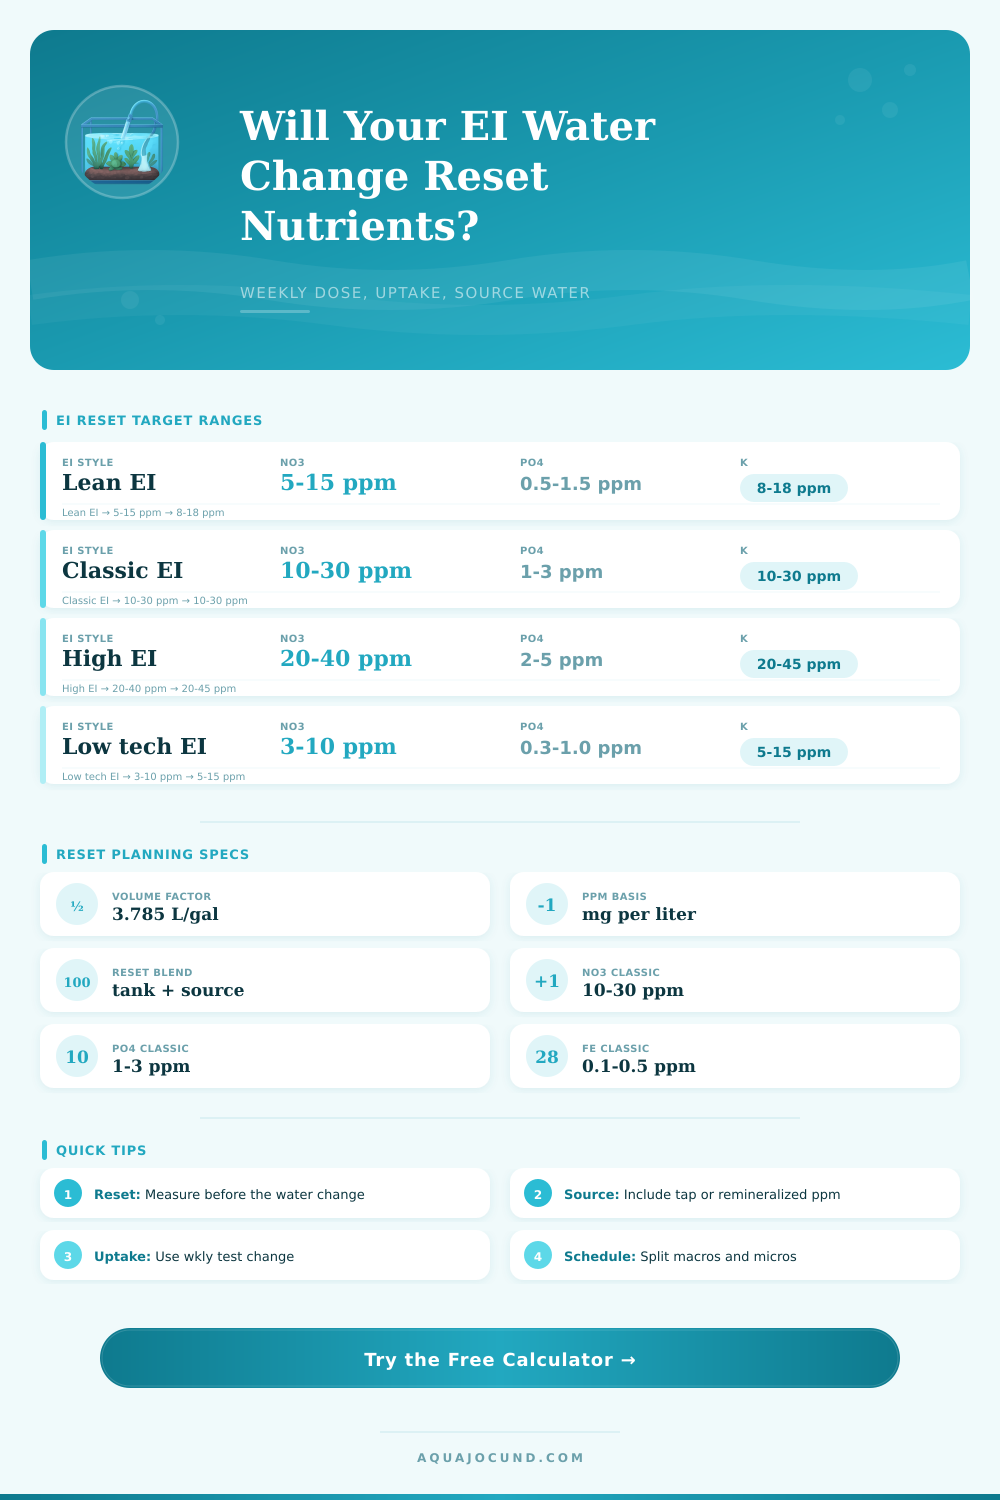
| Target Profile | NO3 Reset Range | PO4 Reset Range | K Reset Range | Fe Reset Range |
|---|---|---|---|---|
| Lean EI planted display | 5-15 ppm | 0.5-1.5 ppm | 8-18 ppm | 0.05-0.20 ppm |
| Classic EI 50% reset | 10-30 ppm | 1.0-3.0 ppm | 10-30 ppm | 0.10-0.50 ppm |
| High light CO2 EI | 20-40 ppm | 2.0-5.0 ppm | 20-45 ppm | 0.20-0.70 ppm |
| Low tech modified EI | 3-10 ppm | 0.3-1.0 ppm | 5-15 ppm | 0.03-0.15 ppm |
| Dutch stem grow-out | 20-45 ppm | 2.0-6.0 ppm | 20-50 ppm | 0.20-0.80 ppm |
| Shrimp-safe lean EI | 3-12 ppm | 0.3-1.2 ppm | 5-15 ppm | 0.03-0.15 ppm |
| Holding tank reset | 2-8 ppm | 0.2-0.8 ppm | 3-12 ppm | 0.02-0.10 ppm |
📋 Reference Tables
| Common Tank | Volume | Approx Liters | Classic Weekly NO3 | Classic Weekly PO4 |
|---|---|---|---|---|
| 10 gallon nano | 10 gal | 38 L | 757 mg NO3 | 114 mg PO4 |
| 20 gallon long | 20 gal | 76 L | 1514 mg NO3 | 227 mg PO4 |
| 40 breeder | 40 gal | 151 L | 3028 mg NO3 | 454 mg PO4 |
| 75 gallon display | 75 gal | 284 L | 5678 mg NO3 | 852 mg PO4 |
| 120 gallon planted | 120 gal | 454 L | 9085 mg NO3 | 1363 mg PO4 |
| Water Change | Residual Left | New Source Share | Best Use | Reset Note |
|---|---|---|---|---|
| 30% | 70% | 30% | Low tech or lean dosing | Carryover remains high |
| 40% | 60% | 40% | Moderate EI | Good compromise reset |
| 50% | 50% | 50% | Classic EI | Simple halving rule |
| 60% | 40% | 60% | High light EI | Stronger weekly reset |
| 75% | 25% | 75% | Correction reset | Large change, match parameters |
| Schedule | Macro Events | Micro Events | Example Week | Calculator Use |
|---|---|---|---|---|
| Alternating 3 + 3 | 3 | 3 | Macro, micro, macro, micro, macro, micro, reset | Classic EI split |
| Daily split | 7 | 7 | Small macro and micro daily | Lowest swing |
| Front-load | 1 | 3 | Macros after reset, micros later | Largest macro swing |
| Twice weekly | 2 | 2 | Two macro and two micro doses | Simple low-maintenance plan |
| Auto doser | 7 | 7 | Daily automated splits | Stable ppm trend |
💡 Practical EI Reset Tips
Each week, you add gallons of nutrient solution to your planted tank. Green stems shoot up from the substrate, expand their footprint and give the effect of a lush carpet. Sunday arrives. Now you siphon out half the water, replace with fresh RO or tap mix and pray nothing falls down.
Many aquascapers turn white at this point. The worry: Take away too much and the plants runs out of food mid-week. Leave in too much, and algae has took over by Monday morning. The aquascape hobby hangs on that delicate balance between enough nutrients to keep things growing while not so much that something biologically dies (and starts falling down).
Simple Ways to Manage Tank Nutrients
Yes, it’s an additive hobby. But also, it’s a management hobby. Managing the leftovers after the reset. It sounds complicated (and I guess it is), if we’re talking math. But it’s really just simple algebra dressed up like chemistry.
We begin with some existing nutrients in the water column. Then we add our weekly dose of iron, potassium, nitrates, phosphates, etc. Over the course of the week, plants absorbs a portion of that nutrient load according to their growth rate. What remains in the water column will sit there until you pull the plug on the siphon. In short: you dose, plants consume a chunk of that load and what is left over sits in the tank until your water change.
And the calculator above does all the number crunching (subtraction/multiplication) for you. All you have to do is plug in your EI profile and your tank size. Make sure to use the volume after accounting for hardscape and substrate displacement. Then, let it run through the numbers. A ppm swing in a ten gallon nano is not the same as a ppm swing in a seventy-five gallon display. The smaller the water body, the steeper the peaks and valleys of nutrient concentration.
People vastly underestimate their source water contribution to the end mix. For example, if you have five parts per million of nitrate in your tap water, that never goes away. Every time you change and add another drop it will blend back in. Never think you can treat each tank like it begins at zero. That’s called the carryover effect. It requires accounting for what you’re putting back in the same way you account for what you purposefuly dose.
By entering your source water parameters into the tool, you get a realistic view of where you begin after a change. Without knowing this, everything you do to dose is based off guesswork. Maybe you assumed your well water was pure, but it actualy contained trace amounts of phosphate. Because of this, you’ve been overdosing all along.
How hard you push it depends on what target range you select. For lowlight tanks or ones that require stable but not necessarily high nutrient readings (e.g, shrimp), a minimal EI regime will be enough. If you’ve got a tank with strong lighting, CO2 injection and want things growing quickly, classic EI pushes harder, higher ranges of nitrates/phosphates are fine as long as there’s enough “fuel” to go around. And if you’ve got really fast growers like some stem plant in a high tech setup, then you’ll need to run even heavier guns so they don’t starve from any deficiency.
The chart on the page breaks all this down nicely; it shows how each style maps to a given set of ppm targets. One common error here is to mismatch light levels with the nutrient profile. Running high nutrients under low lights is an invitation for algae bloom. Plants are being fed too much food when they can’t use it. Match input to power under the hood.
How does it work? Surprisingly, timing affects plant health. When you treat with all of your macros at the same time, your plants experiences huge concentration swings. Levels are super-high immediately after treatment and then crash before the next treatment. By splitting doses over 3+ days, you maintain a steadier stream which they can use gradually. The calculator splits your week’s total by day or split. This shows the maximum concentration swing, meaning how much it spikes right after dosing and crashes before the next dose. Steady concentration encourages even growth & coloration; big swings cause stress to sensitive species.
Don’t be afraid to dose too little, consistency trumps intensity every time. Always test at the same time in the cycle, ideally right before the water change. A pre-change test today and one done mid-week last month is comparing apples to oranges…with variables that are beyond your control. Old leaves decay, new ones come on and uptake will be different. When you measure at the reset point, you’re isolating the system’s steady state.
Use the tool to help you understand what the numbers mean by looking at whether or not your post-change numbers are within your target range. Run them high? Dose less. Run them low? You may want to up your % of water changed and limit nutrients for your growth. This is the bottom line.
A well-planted tank is a combination of patience and chemistry. Patience for nature, and chemistry provided by the calculator. You also need patience as you watch the plants react to changes in nutrients and other parameters like hardness or pH. In many ways, it’s the observation that provides the wisdom, not the number on a test strip. Maybe the most valuable piece of data isn’t even recorded on a test strip. It is the lack of fuzzy green algae patches on your glass, or the new growth on a plant showing off its crisp red tips.
That’s when you get it; the rhythm of dosing, uptake, and resetting. Your anxiety subsides and you move past guesswork and into management mode. The water clears. The greens flourish. And that Sunday task turns into a less chore-like routine … more of a manageable expectation.