Planted Tank Phosphate Uptake Calculator
Estimate phosphate uptake from starting and ending PO4, observation days, tank volume, plant mass, light and CO2 intensity, feeding input, substrate binding, and water-change dilution.
🌿Phosphate Uptake Presets
⚖PO4 Log, Biomass, Sources, and Export
Use real water volume after substrate, hardscape, filters, sump level, and open top allowance.
Estimate wet plant mass in the tank, not dry biomass. Fresh trimmings can help calibrate this number.
Used only for the interpretation band, not to inflate measured uptake.
Many prepared foods sit near 0.8% to 1.5% phosphorus by weight.
A partial credit avoids treating every gram of food phosphorus as immediately dissolved PO4.
Fresh aquasoil, clay-rich caps, laterite, and active substrates can temporarily bind part of apparent PO4 removal.
Phosphate Uptake Result
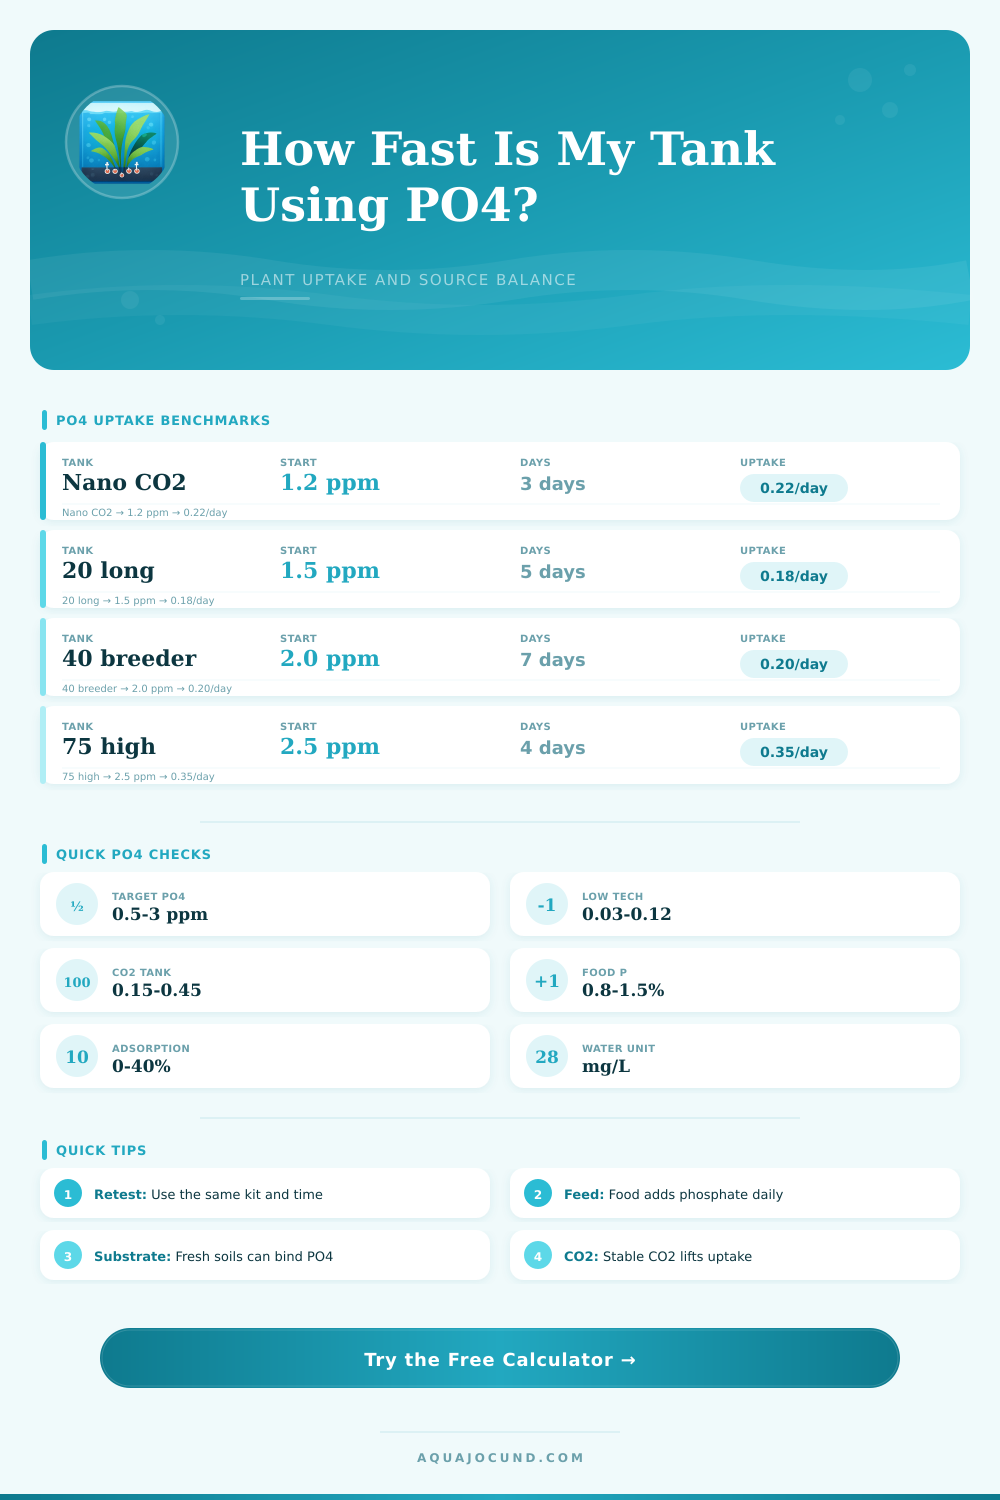
📊Live Calculation Benchmarks
🔁Phosphate Source and Export Comparison Grid
Plant Uptake
Measured decline after correcting for feeding, dosing, water changes, and substrate binding.
Usually 0.03 to 0.45 ppm/dayFish Feeding
Food phosphorus converts to phosphate equivalent, but only part becomes dissolved during the log.
Often 0.01 to 0.20 ppm/dayWater Changes
Replacement water can either dilute tank phosphate or add a small baseline source.
Depends on source PO4Substrate Binding
Fresh active soils and clay-heavy caps can hide PO4 from the water column without plant uptake.
Commonly 5% to 40%🌱Light, CO2, and Uptake Reference
| Growth Profile | Typical PO4 Uptake | Plant Mass Signal | Interpretation Note |
|---|---|---|---|
| Low light, no CO2 | 0.03-0.12 ppm/day | Slow trimming cycle | Feeding may cover most phosphate demand |
| Medium light, mild CO2 | 0.08-0.22 ppm/day | Steady weekly trimming | Deficiencies show as stalled uptake |
| Pressurized CO2 | 0.15-0.35 ppm/day | Fast stems and carpets | Needs matching nitrate, potassium, and micros |
| High light, strong CO2 | 0.25-0.55 ppm/day | Heavy trimming | Low PO4 can appear quickly between doses |
| Floating plant dominated | 0.10-0.40 ppm/day | Harvested surface biomass | Shade can reduce submerged plant uptake |
| Emersed or riparium | 0.15-0.60 ppm/day | Roots and emerged leaves | Often exports nutrients faster than submerged growth |
💧Common Tank PO4 Log Examples
| Tank | Water Volume | Useful Test Window | Typical Plant Mass | PO4 Planning Range |
|---|---|---|---|---|
| 5 gal nano / 19 L | 4-5 gal / 15-19 L | 2-4 days | 1-4 oz / 28-113 g | 0.3-1.5 ppm |
| 10 gal planted / 38 L | 8-10 gal / 30-38 L | 3-5 days | 3-8 oz / 85-227 g | 0.5-2.0 ppm |
| 20 long / 76 L | 16-20 gal / 61-76 L | 4-7 days | 8-18 oz / 227-510 g | 0.8-2.5 ppm |
| 40 breeder / 151 L | 32-40 gal / 121-151 L | 4-7 days | 16-36 oz / 454-1021 g | 1.0-3.0 ppm |
| 55 gal display / 208 L | 45-55 gal / 170-208 L | 4-7 days | 20-48 oz / 567-1361 g | 1.0-3.0 ppm |
| 75 gal high tech / 284 L | 60-75 gal / 227-284 L | 3-6 days | 36-80 oz / 1021-2268 g | 1.5-4.0 ppm |
| 125 gal Dutch / 473 L | 100-125 gal / 379-473 L | 3-6 days | 70-160 oz / 1984-4536 g | 1.5-5.0 ppm |
🧪Phosphate Source and Export Table
| Balance Item | Calculator Role | Common Range | What Raises It | What Lowers It |
|---|---|---|---|---|
| Measured water-column drawdown | Main uptake signal | 0.05-0.50 ppm/day | Strong growth and dosing | Low biomass or deficiencies |
| Fish food phosphorus | Daily input source | 0.8-1.5% P | More food or higher fish load | Rinsed foods or less feeding |
| Fertilizer phosphate | Known added ppm | 0.2-3 ppm per dose | KH2PO4 or macro mixes | Lean dosing schedules |
| Water change dilution | Correction term | 10-50% routine | Large changes with low source PO4 | High source PO4 water |
| Substrate adsorption | Non-plant sink split | 0-40% typical | Fresh soil, clay, laterite | Mature inert substrate |
| Plant harvest export | Real nutrient removal | Trim dependent | Fast stems and floaters | Melting or shaded growth |
🔧Substrate Adsorption Factor Reference
| Substrate Situation | Suggested Factor | PO4 Behavior | Calculator Caution |
|---|---|---|---|
| Inert sand or gravel, mature tank | 0-5% | Little water-column binding | Most decline is likely biological uptake or export |
| Established planted aquasoil | 5-15% | Moderate buffering | Adsorption is usually smaller after the first months |
| Fresh active aquasoil | 20-45% | Rapid early binding possible | Retest after the substrate matures |
| Clay cap or laterite pockets | 10-30% | Localized phosphate binding | Root-zone uptake may not match water tests |
| Phosphate remover present | 40-90% | Chemical media dominates removal | Do not read this as plant uptake |
You change your water and dose your nutrients… and everything appears fine; the plants is healthy, the water is clear…but then your phosphate test seems to be all over the place. Something doesn’t add up, right? No leaks, no magic, just math interacting with biology. How do you know how much of that phosphate was consumed by plant vs. How much dissolved in the new water or dissapears into your substrate? That’s where this calculator comes in:
Most keepers stop at starting and ending numbers. The number drops to zero? Plants must’ve taken it all… Wrong! Phosphate is a stubborn nutrient with very complicated interaction with its surroundings. It sticks to particles (particularly clay). It’s gobbled up by bacteria. It settles into waste products and isn’t released again until changes occur in pH. If you don’t account for these hidden reserve, you’re going to overdose your tank as you attempt to replenish what has been removed instead of what has left the water.
Understanding Phosphate in Your Tank
Focus on where the nutrient goes, not how much is still present in water column. The inputs matter more than the output. To calculate phosphate uptake, you enter how much plant mass there is in the tank, and the rate of uptake normalize based on size of tank. That way, you can compare uptakes across tanks of different sizes properly. After all, a single, sparsely growing stem plant doesn’t take up phosphate anywhere near as fast as a densely planted carpet of several species do. The calculator takes that into account.
You’ll have to be honest about your feeding habits, too. Phosphorus makes up somewhere between 1-1.5% by weight of fish food. This means that some amount of phosphate enters water column slowly. If you don’t include this input, then the calculator will assume that all the phosphate comes from doses of fertilizer. This leads it to believe that uptake is greater than it actualy is.
Your dosing schedule isn’t correct. Your substrate binds phosphate. In fact, fresh aquatic soil can absorbs 20-40% of any phosphate you add within the first few months; even if no plants are growing near it. It’s not lost; it’s stored for future release once the water column dip low. If you account for that initial binding as uptake by your plants, you’ll run out of reserve while continuing to dose full-strength. Know difference between immediate uptake and long-term substrate buffering.
Things get even trickier when considering water changes. If tap water has a small amount of phosphate (common), then a drop in concentration may not be noticeable. Alternatively, the tank water might simply be diluted making it seem like the plants consumed more than they actualy did. Depending on the type of tank, this variability can shift values on the reference table. For example, low-tech tanks like those for shrimps change very gradually so week-to-week shifts could be nothing more than noise. On the other hand, complex tanks like high-light setups with pressurized CO2 use up phosphate quickly and need close monitoring. Knowing what’s typical for your own growth profile will tell you whether a daily drop is cause for concern or not.
One good example is that aquarium keeping doesn’t require perfect precision. No one expects lab accurate results from test kits (they have error margins) nor does anyone expect 100% of every drop of water to move in your tank (dead zones exist). Rather, aquarium keeping involve developing a mental model of how your tank’s metabolism works. When you account for the hidden sinks (e.g., adsorption on substrates), plant weight, and water volume, the mystery dissapears. You no longer guess at what causes numbers to change; rather, you understand how to manage the balance intentionaly. And when you look into the water, you see perfection…because you know exactly why it remains that way.