Aquarium LED Running Cost Calculator
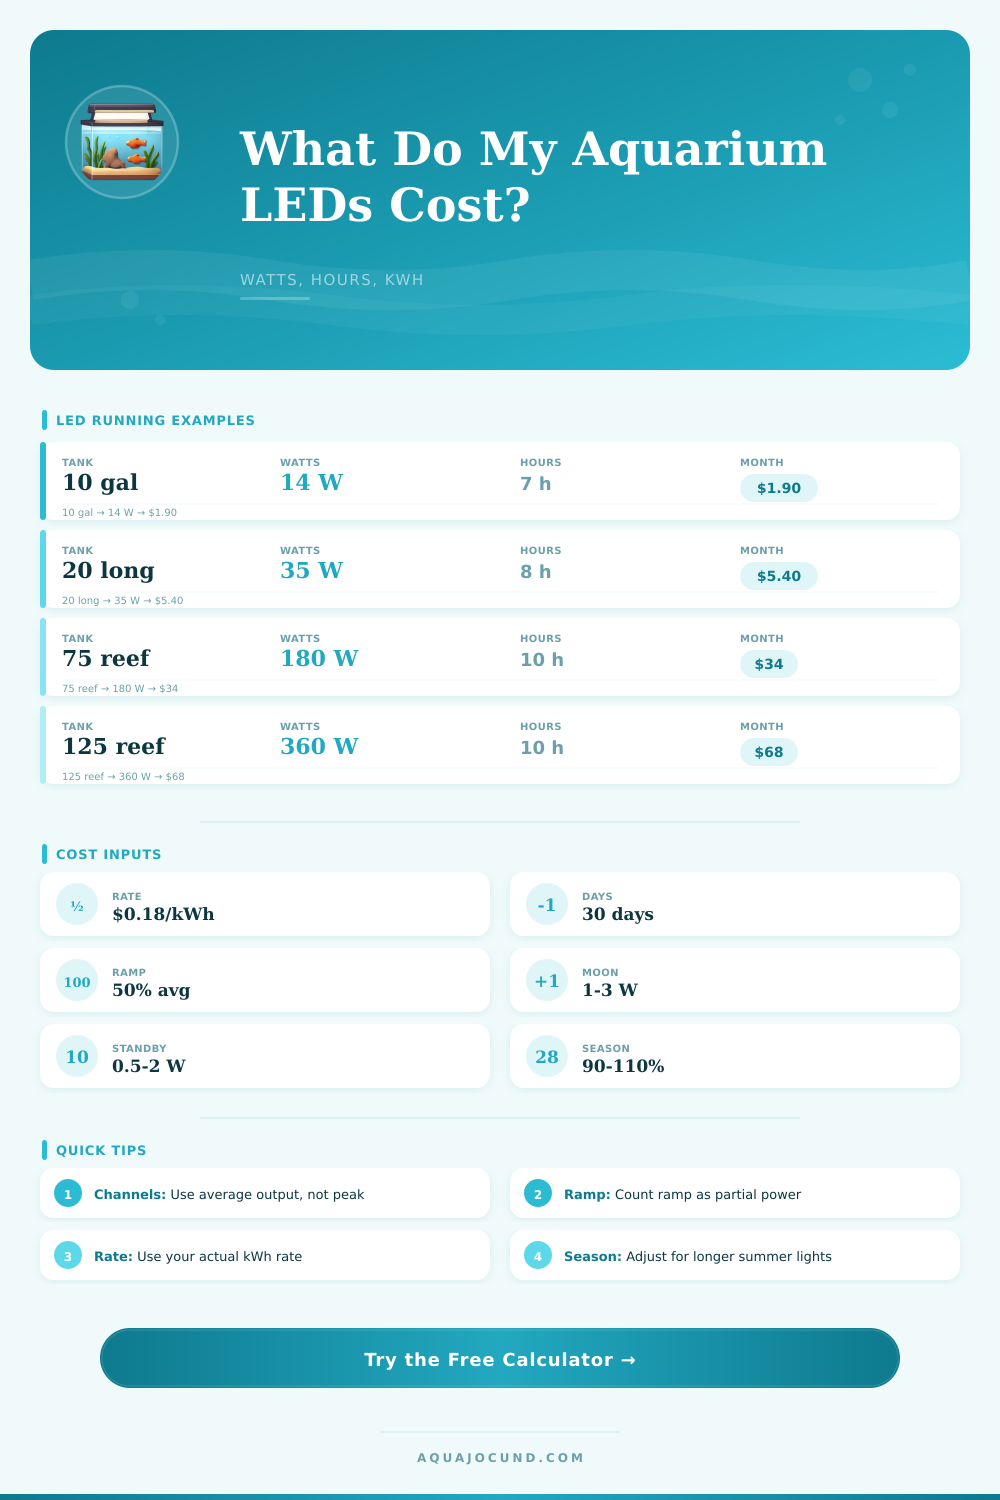
Estimate LED kWh and operating cost from fixture watts, channel intensity, photoperiod, ramp time, fixture count, electric rate, days, and seasonal adjustment.
📏Tank size and light class
💡LED schedule and electric rate
Use the fixture's maximum draw, then adjust with channel percentage.
Blend white, blue, red, and UV channels into one average percentage.
Calculation breakdown
🔆PAR and light class comparison
📊Reference tables
| Light class | Typical PAR range | Power pattern | Schedule note |
|---|---|---|---|
| Fish-only viewing | 20 to 40 PAR | Low wattage, modest channels | 6 to 8 display hours |
| Low light planted | 30 to 60 PAR | Low to medium power | 6 to 8 hours limits algae pressure |
| Medium planted | 60 to 100 PAR | Medium power with balanced spectrum | 7 to 8 hours is common |
| High light planted | 100 to 180 PAR | High channel output | Often paired with CO2 control |
| Soft coral reef | 50 to 100 PAR | Blue-heavy moderate output | 8 to 10 hours including ramp |
| Mixed reef | 100 to 200 PAR | Moderate to high output | Stable daily repeatability matters |
| SPS reef | 200 to 350 PAR | High output, often multiple fixtures | Use acclimation when increasing power |
| Frag grow-out | 150 to 300 PAR | Focused output over shallow water | Schedule depends on rack depth |
| Common tank | Dimensions | Volume | Typical LED draw |
|---|---|---|---|
| 5 gallon | 16 x 8 x 10 in / 41 x 20 x 25 cm | 5 gal / 19 L | 6 to 12 W at 50 to 80% |
| 10 gallon | 20 x 10 x 12 in / 51 x 25 x 30 cm | 10 gal / 38 L | 10 to 20 W at 50 to 80% |
| 20 long | 30 x 12 x 12 in / 76 x 30 x 30 cm | 20 gal / 76 L | 25 to 45 W at 55 to 85% |
| 29 gallon | 30 x 12 x 18 in / 76 x 30 x 46 cm | 29 gal / 110 L | 30 to 60 W at 60 to 90% |
| 40 breeder | 36 x 18 x 16 in / 91 x 46 x 41 cm | 40 gal / 151 L | 45 to 90 W at 60 to 90% |
| 75 gallon | 48 x 18 x 21 in / 122 x 46 x 53 cm | 75 gal / 284 L | 120 to 220 W at 55 to 85% |
| 125 gallon | 72 x 18 x 21 in / 183 x 46 x 53 cm | 125 gal / 473 L | 240 to 420 W at 55 to 85% |
| Schedule type | Full output | Ramp total | Cost effect |
|---|---|---|---|
| Short display | 5 to 6 hours | 0.5 to 1 hour | Lowest recurring energy |
| Standard planted | 6 to 8 hours | 1 to 2 hours | Balanced output and viewing |
| Reef blue ramp | 7 to 9 hours | 2 to 4 hours | Ramp can add meaningful kWh |
| Grow-out rack | 8 to 10 hours | 0.5 to 2 hours | Higher output and longer month total |
| Formula item | Calculator treatment | Why it matters | Typical range |
|---|---|---|---|
| Channel percent | Rated watts x average output | LEDs rarely run at 100% all day | 35% to 90% |
| Ramp hours | Ramp hours x ramp average | Dawn and dusk still consume power | 35% to 75% average |
| Moonlight | Low wattage x moon hours | Small, but included for long nights | 0 to 3 W per fixture |
| Standby | Total standby watts x 24 hours | Controllers may draw power off-cycle | 0 to 2 W total |
| Season adjustment | Monthly kWh x seasonal percent | Accounts for temporary longer schedules | 90% to 110% |
💡LED cost tips
So you purchased an LED fixture because it was said to provide clear light for your reef for less money. You were feeling pretty smug as you went to the cash register. And then initial electric bill comes in the mail and you think “uh-oh, this can’t be right!”. What’s going on here?
The problem lie in knowing what’s actualy getting measured; it isn’t always immediately apparent just by looking at a lit-up tank. Most hobbyists presume that light rated as thirty watts draw thirty watts throughout the day. It’s there that the budget tap begins to run.
How to Calculate Your Reef Tank Electricity Cost
Fortunately, calculator on this page does all of that math for us. It break down exactly what portion of that energy those diodes consume in the long run. There’s no complicated algebra, no multimeter required, just the honest truth, if you’re willing to look behind the sticker rating.
Here’s the deal: No one operate their aquarium at full capacity twenty-four hours per day. That’s why we refer to wattage of the fixtures as the starting number; it represents nothing more than that. In reality, we mix channels. We bump up some while dimming others, depending off our specific goals. We want more blue for healthy corals, yet we also want dimmer whites for comfortabley fish. In the end, it’s the average output percentage that determine how much power will be drawn. If you have a mixed reef set up and operate it at an average of sixty five percent channel output, then congratulations, you save big bucks different than running everything at full power.
Beyond the obvious stuff, ramp times also add complexity. Many folks completely forget about these, or don’t think they apply to their setup. Two hour sunrise sim? Yes, light is still lit during those two hours. Even though it may be slowly fading. It’s still sucking down energy. This is where you can input your ramp hours into the tool, along with a general power percentage it will consume while ramping. Typically a linear ramp averages to 50% of peak draw. So yes, that extra two hour at both ends aren’t free either. This happen particularly in summer, when you’re extending the day further so corals can photosynthesize longer.
Moonlight is another sneaky addition to the monthly cost. I know… You can’t see it and it sounds harmless but add that watt (or a couple) over twenty four seven operation and it adds up. Controllers left plugged in when not operating is also part of the standby power issue. There are fields on the calculator for these small draws so you get the full picture, no optimistic best case scenarios here. Small inefficiencies compound over twelve month of continuous running.
The last multiplier is the one that converts the kilowatt hours into real money, your electric rate. Your rate depends on your location as well as any time of day rates, such as peak vs. Off-peak. The only rate that matters to your wallet are your own (taken directly from your electricity bill). The tables that comes along with the calculator will give some context regarding what’s typical. For example, a nano tank with some basic fish could cost $1, 2 per month, whereas a big SPS reef system can easily run upwards of $30. This range lets you know when something may be running inefficiently in your set-up.
Plants require light intensity to not turn brown and die off. That means high light planted tanks demands more energy. Cut corners there and you’ll pay for that in health. On the other hand, if you have a fish only display, you may well be over lighting simply because the fixture can do it. The dimmers will let you tone that back a bit so you aren’t hurting your tetras and you can save some money on the bill. It’s a little thing but it add up when you’re trying to keep your costs down.
Finally, there are seasonal changes which make sense, too. In July, you probably have lights on longer then in January. This tool lets you account for that change so your annual estimate won’t reflect an average, but instead something more representative of what you’re doing at any given time of year. This will help you budget better for those heavier summer months where you not only has the aquarium equipment running, but the air conditioning as well. You should of planned for it.
At the end of the day, it’s all about knowing your expenses. What you don’t know, you can’t control. When you track every single expense related to running an aquarium, you are able to make smart choices regarding frequency and duration. No more guesswork on the bill. Just numbers you can use.
Lights stays on. The tank stays healthy. You stop worrying about the electricity bill.